HSBC 2010 Annual Report Download - page 365
Download and view the complete annual report
Please find page 365 of the 2010 HSBC annual report below. You can navigate through the pages in the report by either clicking on the pages listed below, or by using the keyword search tool below to find specific information within the annual report.-
 1
1 -
2
-
3
-
4
-
5
-
6
-
7
-
8
-
9
-
10
-
11
-
12
-
13
-
14
-
15
-
16
-
17
-
18
-
19
-
20
-
21
-
22
-
23
-
24
-
25
-
26
-
27
-
28
-
29
-
30
-
31
-
32
-
33
-
34
-
35
-
36
-
37
-
38
-
39
-
40
-
41
-
42
-
43
-
44
-
45
-
46
-
47
-
48
-
49
-
50
-
51
-
52
-
53
-
54
-
55
-
56
-
57
-
58
-
59
-
60
-
61
-
62
-
63
-
64
-
65
-
66
-
67
-
68
-
69
-
70
-
71
-
72
-
73
-
74
-
75
-
76
-
77
-
78
-
79
-
80
-
81
-
82
-
83
-
84
-
85
-
86
-
87
-
88
-
89
-
90
-
91
-
92
-
93
-
94
-
95
-
96
-
97
-
98
-
99
-
100
-
101
-
102
-
103
-
104
-
105
-
106
-
107
-
108
-
109
-
110
-
111
-
112
-
113
-
114
-
115
-
116
-
117
-
118
-
119
-
120
-
121
-
122
-
123
-
124
-
125
-
126
-
127
-
128
-
129
-
130
-
131
-
132
-
133
-
134
-
135
-
136
-
137
-
138
-
139
-
140
-
141
-
142
-
143
-
144
-
145
-
146
-
147
-
148
-
149
-
150
-
151
-
152
-
153
-
154
-
155
-
156
-
157
-
158
-
159
-
160
-
161
-
162
-
163
-
164
-
165
-
166
-
167
-
168
-
169
-
170
-
171
-
172
-
173
-
174
-
175
-
176
-
177
-
178
-
179
-
180
-
181
-
182
-
183
-
184
-
185
-
186
-
187
-
188
-
189
-
190
-
191
-
192
-
193
-
194
-
195
-
196
-
197
-
198
-
199
-
200
-
201
-
202
-
203
-
204
-
205
-
206
-
207
-
208
-
209
-
210
-
211
-
212
-
213
-
214
-
215
-
216
-
217
-
218
-
219
-
220
-
221
-
222
-
223
-
224
-
225
-
226
-
227
-
228
-
229
-
230
-
231
-
232
-
233
-
234
-
235
-
236
-
237
-
238
-
239
-
240
-
241
-
242
-
243
-
244
-
245
-
246
-
247
-
248
-
249
-
250
-
251
-
252
-
253
-
254
-
255
-
256
-
257
-
258
-
259
-
260
-
261
-
262
-
263
-
264
-
265
-
266
-
267
-
268
-
269
-
270
-
271
-
272
-
273
-
274
-
275
-
276
-
277
-
278
-
279
-
280
-
281
-
282
-
283
-
284
-
285
-
286
-
287
-
288
-
289
-
290
-
291
-
292
-
293
-
294
-
295
-
296
-
297
-
298
-
299
-
300
-
301
-
302
-
303
-
304
-
305
-
306
-
307
-
308
-
309
-
310
-
311
-
312
-
313
-
314
-
315
-
316
-
317
-
318
-
319
-
320
-
321
-
322
-
323
-
324
-
325
-
326
-
327
-
328
-
329
-
330
-
331
-
332
-
333
-
334
-
335
-
336
-
337
-
338
-
339
-
340
-
341
-
342
-
343
-
344
-
345
-
346
-
347
-
348
-
349
-
350
-
351
-
352
-
353
-
354
-
 355
355 -
 356
356 -
 357
357 -
 358
358 -
 359
359 -
 360
360 -
 361
361 -
 362
362 -
 363
363 -
 364
364 -
 365
365 -
 366
366 -
 367
367 -
 368
368 -
 369
369 -
 370
370 -
 371
371 -
 372
372 -
 373
373 -
 374
374 -
 375
375 -
376
-
377
-
378
-
379
-
380
-
381
-
382
-
383
-
384
-
385
-
386
-
387
-
388
-
389
-
390
-
391
-
392
-
393
-
394
-
395
-
396
 |
 |

363
Overview Operating & Financial Review Governance Financial Statements Shareholder Information
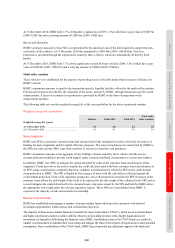
At 31 December 2010, HSBC held 1.3% of Mazarin’s capital notes (2009: 1.3%) which have a par value of US$17m
(2009: US$17m) and a carrying amount of US$0.6m (2009: US$0.6m).
Barion and Malachite
HSBC’s primary exposure to these SICs is represented by the amortised cost of the debt required to support the non-
cash assets of the vehicles. At 31 December 2010 this amounted to US$9.4bn (2009: US$10.5bn). First loss
protection is provided through the capital notes issued by these vehicles, which are substantially all held by third
parties.
At 31 December 2010, HSBC held 3.7% of the capital notes issued by these vehicles (2009: 3.8%) which have a par
value of US$35m (2009: US$37m) and a carrying amount of US$2m (2009: US$2m).
Multi-seller conduits
These vehicles were established for the purpose of providing access to flexible market-based sources of finance for
HSBC’s clients.
HSBC’s maximum exposure is equal to the transaction-specific liquidity facilities offered to the multi-seller conduits.
First loss protection is provided by the originator of the assets, and not by HSBC, through transaction-specific credit
enhancements. A layer of secondary loss protection is provided by HSBC in the form of programme-wide
enhancement facilities.
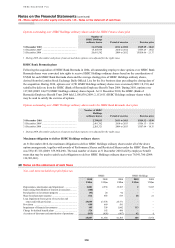
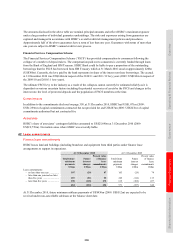
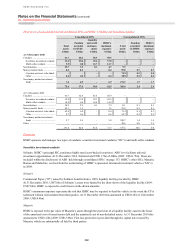
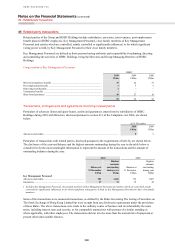
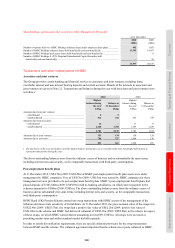
The following table sets out the weighted average life of the asset portfolios for the above mentioned conduits.
Weighted average life of portfolios
Solitaire Other SICs Total SICs
Total multi-
seller conduits
Weighted average life (years)
At 31 December 2010 ....................................................... 5.1 4.0 4.4 1.8
At 31 December 2009 ........................................................ 6.3 4.1 4.9 2.4
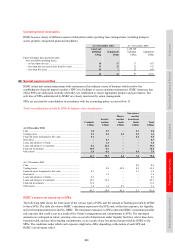
Securitisations
HSBC uses SPEs to securitise customer loans and advances that it has originated in order to diversify its sources of
funding for asset origination and for capital efficiency purposes. The loans and advances are transferred by HSBC to
the SPEs for cash, and the SPEs issue debt securities to investors to fund the cash purchases.
HSBC’s maximum exposure is the aggregate of any holdings of notes issued by these vehicles and the reserve
account positions intended to provide credit support under certain pre-defined circumstances to senior note holders.
In addition, HSBC uses SPEs to mitigate the capital absorbed by some of the customer loans and advances it has
originated. Credit derivatives are used to transfer the credit risk associated with these customer loans and advances to
an SPE, using securitisations commonly known as synthetic securitisations by which the SPE writes credit default
swap protection to HSBC. The SPE is funded by the issuance of notes with the cash held as collateral against the
credit default protection. From a UK regulatory perspective, the credit protection issued by the SPE in respect of the
customer loans allows the risk weight of the loans to be replaced by the risk weight of the collateral in the SPE and as
a result mitigates the capital absorbed by the customer loans. Any notes issued by the SPE and held by HSBC attract
the appropriate risk weight under the relevant regulatory regime. These SPEs are consolidated when HSBC is
exposed to the majority of risks and rewards of ownership.
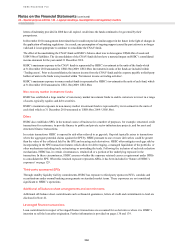
Money market funds
HSBC has established and manages a number of money market funds which provide customers with tailored
investment opportunities within narrow and well-defined objectives.
The majority of these money market funds are Constant Net Asset Value funds (‘CNAV’), which invest in shorter-dated
and highly-rated money market securities with the objective of providing investors with a highly liquid and secure
investment. In September 2008 during the financial crisis, HSBC consolidated certain of its CNAV funds as a result of a
number of actions taken to maintain their AAA rating and mitigate the risks of forced sales of liquid assets to meet potential
redemptions. Since consolidation of the CNAV funds, HSBC has not provided any additional support to the funds and