HSBC 2010 Annual Report Download - page 37
Download and view the complete annual report
Please find page 37 of the 2010 HSBC annual report below. You can navigate through the pages in the report by either clicking on the pages listed below, or by using the keyword search tool below to find specific information within the annual report.-
 1
1 -
2
-
3
-
4
-
5
-
6
-
7
-
8
-
9
-
10
-
11
-
12
-
13
-
14
-
15
-
16
-
17
-
18
-
19
-
20
-
21
-
22
-
23
-
24
-
25
-
26
-
 27
27 -
 28
28 -
 29
29 -
 30
30 -
 31
31 -
 32
32 -
 33
33 -
 34
34 -
 35
35 -
 36
36 -
 37
37 -
 38
38 -
 39
39 -
 40
40 -
 41
41 -
 42
42 -
 43
43 -
 44
44 -
 45
45 -
 46
46 -
 47
47 -
48
-
49
-
50
-
51
-
52
-
53
-
54
-
55
-
56
-
57
-
58
-
59
-
60
-
61
-
62
-
63
-
64
-
65
-
66
-
67
-
68
-
69
-
70
-
71
-
72
-
73
-
74
-
75
-
76
-
77
-
78
-
79
-
80
-
81
-
82
-
83
-
84
-
85
-
86
-
87
-
88
-
89
-
90
-
91
-
92
-
93
-
94
-
95
-
96
-
97
-
98
-
99
-
100
-
101
-
102
-
103
-
104
-
105
-
106
-
107
-
108
-
109
-
110
-
111
-
112
-
113
-
114
-
115
-
116
-
117
-
118
-
119
-
120
-
121
-
122
-
123
-
124
-
125
-
126
-
127
-
128
-
129
-
130
-
131
-
132
-
133
-
134
-
135
-
136
-
137
-
138
-
139
-
140
-
141
-
142
-
143
-
144
-
145
-
146
-
147
-
148
-
149
-
150
-
151
-
152
-
153
-
154
-
155
-
156
-
157
-
158
-
159
-
160
-
161
-
162
-
163
-
164
-
165
-
166
-
167
-
168
-
169
-
170
-
171
-
172
-
173
-
174
-
175
-
176
-
177
-
178
-
179
-
180
-
181
-
182
-
183
-
184
-
185
-
186
-
187
-
188
-
189
-
190
-
191
-
192
-
193
-
194
-
195
-
196
-
197
-
198
-
199
-
200
-
201
-
202
-
203
-
204
-
205
-
206
-
207
-
208
-
209
-
210
-
211
-
212
-
213
-
214
-
215
-
216
-
217
-
218
-
219
-
220
-
221
-
222
-
223
-
224
-
225
-
226
-
227
-
228
-
229
-
230
-
231
-
232
-
233
-
234
-
235
-
236
-
237
-
238
-
239
-
240
-
241
-
242
-
243
-
244
-
245
-
246
-
247
-
248
-
249
-
250
-
251
-
252
-
253
-
254
-
255
-
256
-
257
-
258
-
259
-
260
-
261
-
262
-
263
-
264
-
265
-
266
-
267
-
268
-
269
-
270
-
271
-
272
-
273
-
274
-
275
-
276
-
277
-
278
-
279
-
280
-
281
-
282
-
283
-
284
-
285
-
286
-
287
-
288
-
289
-
290
-
291
-
292
-
293
-
294
-
295
-
296
-
297
-
298
-
299
-
300
-
301
-
302
-
303
-
304
-
305
-
306
-
307
-
308
-
309
-
310
-
311
-
312
-
313
-
314
-
315
-
316
-
317
-
318
-
319
-
320
-
321
-
322
-
323
-
324
-
325
-
326
-
327
-
328
-
329
-
330
-
331
-
332
-
333
-
334
-
335
-
336
-
337
-
338
-
339
-
340
-
341
-
342
-
343
-
344
-
345
-
346
-
347
-
348
-
349
-
350
-
351
-
352
-
353
-
354
-
355
-
356
-
357
-
358
-
359
-
360
-
361
-
362
-
363
-
364
-
365
-
366
-
367
-
368
-
369
-
370
-
371
-
372
-
373
-
374
-
375
-
376
-
377
-
378
-
379
-
380
-
381
-
382
-
383
-
384
-
385
-
386
-
387
-
388
-
389
-
390
-
391
-
392
-
393
-
394
-
395
-
396
 |
 |

35
Overview Operating & Financial Review Governance Financial Statements Shareholder Information
• selecting an appropriate discount rate for
the instrument. The determination of this rate
is based on an assessment of what a market
participant would regard as the appropriate
spread of the rate for the instrument over the
appropriate risk-free rate; and
• judgement to determine what model to use to
calculate fair value in areas where the choice of
valuation model is particularly subjective, for
example, when valuing complex derivative
products.
When applying a model with unobservable
inputs, estimates are made to reflect uncertainties
in fair values resulting from a lack of market data
inputs, for example, as a result of illiquidity in
the market. For these instruments, the fair value
measurement is less reliable. Inputs into valuations
based on unobservable data are inherently uncertain
because there is little or no current market data
available from which to determine the level at which
an arm’s length transaction would occur under
normal business conditions. However, in most cases
there is some market data available on which to base
a determination of fair value, for example historical
data, and the fair values of most financial
instruments are based on some market observable
inputs even when unobservable inputs are
significant.
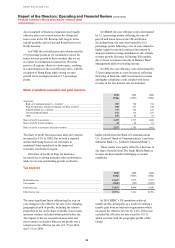
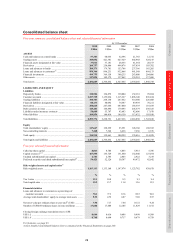
The value of financial assets and liabilities
measured at fair value using a valuation technique
was US$599bn (2009: US$599bn) and US$499bn
(2009: US$447bn), respectively or 56% (2009: 56%)
of total financial assets and 77% (2009: 75%) of
total financial liabilities measured at fair value.
Disclosures of the types and amounts of
adjustments made in determining the fair value of
financial instruments measured at fair value using
valuation techniques, and a sensitivity analysis of
fair values for financial instruments with significant
unobservable inputs to reasonably possible
alternative assumptions can be found in Note 16 on
the Financial Statements. Given the uncertainty and
subjective nature of valuing financial instruments at
fair value, it is possible that the outcomes in the next
financial year could differ from the assumptions
used, and this could result in a material adjustment
to the carrying amount of financial instruments
measured at fair value.
Impairment of available-for-sale financial
assets
Our accounting policy for impairment of available-
for-sale financial assets is described in Note 2j on
the Financial Statements.
At 31 December 2010, our total available-for-
sale financial assets amounted to US$381bn (2009:
US$352bn), of which US$373bn or 98% (2009:
US$342bn; 97%) were debt securities. The
available-for-sale fair value reserve relating to
debt securities amounted to a deficit of US$6.2bn
(2009: deficit of US$11.4bn). A deficit in the
available-for-sale fair value reserve occurs on debt
securities when the fair value of a relevant security
is less than its acquisition cost (net of any principal
repayments and amortisation) after deducting any
previous impairment loss recognised in the income
statement, but where there is no evidence of any
impairment or, if an impairment was previously
recognised, any subsequent impairment.
Management is required to exercise judgement
in determining whether there is objective evidence
that an impairment loss has occurred. Once an
impairment has been identified, the amount of
impairment loss is measured with reference to the
fair value of the asset. More information on
assumptions and estimates requiring management
judgement relating to the determination of fair
values of financial instruments is provided above
in ‘Valuation of financial instruments’.
Deciding whether an available-for-sale debt
security is impaired requires objective evidence of
both the occurrence of a loss event and a related
decrease in estimated future cash flows. The degree
of judgement involved is less when cash flows
are readily determinable, but increases when
estimating future cash flows requires consideration
of a number of variables, some of which may be
unobservable in current market conditions.
There is no single factor to which the Group’s
charge for impairment of available-for-sale debt
securities is particularly sensitive, because of the
various types of securities we hold, the range of
geographical areas in which those securities are held,
and the wide range of factors which can affect the
occurrence of loss events and the cash flows of
securities, including different types of collateral.
The most significant judgements concern more
complex instruments, such as ABSs, where it is
necessary to consider factors such as the estimated
future cash flows on underlying pools of collateral
including prepayment speeds, the extent and depth of
market price declines and changes in credit ratings.
The review of estimated future cash flows on
underlying collateral is subject to uncertainties when
the assessment is based on historical information on
pools of assets, and judgement is required to
determine whether historical performance remains