HSBC 2011 Annual Report Download - page 97
Download and view the complete annual report
Please find page 97 of the 2011 HSBC annual report below. You can navigate through the pages in the report by either clicking on the pages listed below, or by using the keyword search tool below to find specific information within the annual report.-
 1
1 -
2
-
3
-
4
-
5
-
6
-
7
-
8
-
9
-
10
-
11
-
12
-
13
-
14
-
15
-
16
-
17
-
18
-
19
-
20
-
21
-
22
-
23
-
24
-
25
-
26
-
27
-
28
-
29
-
30
-
31
-
32
-
33
-
34
-
35
-
36
-
37
-
38
-
39
-
40
-
41
-
42
-
43
-
44
-
45
-
46
-
47
-
48
-
49
-
50
-
51
-
52
-
53
-
54
-
55
-
56
-
57
-
58
-
59
-
60
-
61
-
62
-
63
-
64
-
65
-
66
-
67
-
68
-
69
-
70
-
71
-
72
-
73
-
74
-
75
-
76
-
77
-
78
-
79
-
80
-
81
-
82
-
83
-
84
-
85
-
86
-
 87
87 -
 88
88 -
 89
89 -
 90
90 -
 91
91 -
 92
92 -
 93
93 -
 94
94 -
 95
95 -
 96
96 -
 97
97 -
 98
98 -
 99
99 -
 100
100 -
 101
101 -
 102
102 -
 103
103 -
 104
104 -
 105
105 -
 106
106 -
 107
107 -
108
-
109
-
110
-
111
-
112
-
113
-
114
-
115
-
116
-
117
-
118
-
119
-
120
-
121
-
122
-
123
-
124
-
125
-
126
-
127
-
128
-
129
-
130
-
131
-
132
-
133
-
134
-
135
-
136
-
137
-
138
-
139
-
140
-
141
-
142
-
143
-
144
-
145
-
146
-
147
-
148
-
149
-
150
-
151
-
152
-
153
-
154
-
155
-
156
-
157
-
158
-
159
-
160
-
161
-
162
-
163
-
164
-
165
-
166
-
167
-
168
-
169
-
170
-
171
-
172
-
173
-
174
-
175
-
176
-
177
-
178
-
179
-
180
-
181
-
182
-
183
-
184
-
185
-
186
-
187
-
188
-
189
-
190
-
191
-
192
-
193
-
194
-
195
-
196
-
197
-
198
-
199
-
200
-
201
-
202
-
203
-
204
-
205
-
206
-
207
-
208
-
209
-
210
-
211
-
212
-
213
-
214
-
215
-
216
-
217
-
218
-
219
-
220
-
221
-
222
-
223
-
224
-
225
-
226
-
227
-
228
-
229
-
230
-
231
-
232
-
233
-
234
-
235
-
236
-
237
-
238
-
239
-
240
-
241
-
242
-
243
-
244
-
245
-
246
-
247
-
248
-
249
-
250
-
251
-
252
-
253
-
254
-
255
-
256
-
257
-
258
-
259
-
260
-
261
-
262
-
263
-
264
-
265
-
266
-
267
-
268
-
269
-
270
-
271
-
272
-
273
-
274
-
275
-
276
-
277
-
278
-
279
-
280
-
281
-
282
-
283
-
284
-
285
-
286
-
287
-
288
-
289
-
290
-
291
-
292
-
293
-
294
-
295
-
296
-
297
-
298
-
299
-
300
-
301
-
302
-
303
-
304
-
305
-
306
-
307
-
308
-
309
-
310
-
311
-
312
-
313
-
314
-
315
-
316
-
317
-
318
-
319
-
320
-
321
-
322
-
323
-
324
-
325
-
326
-
327
-
328
-
329
-
330
-
331
-
332
-
333
-
334
-
335
-
336
-
337
-
338
-
339
-
340
-
341
-
342
-
343
-
344
-
345
-
346
-
347
-
348
-
349
-
350
-
351
-
352
-
353
-
354
-
355
-
356
-
357
-
358
-
359
-
360
-
361
-
362
-
363
-
364
-
365
-
366
-
367
-
368
-
369
-
370
-
371
-
372
-
373
-
374
-
375
-
376
-
377
-
378
-
379
-
380
-
381
-
382
-
383
-
384
-
385
-
386
-
387
-
388
-
389
-
390
-
391
-
392
-
393
-
394
-
395
-
396
-
397
-
398
-
399
-
400
-
401
-
402
-
403
-
404
-
405
-
406
-
407
-
408
-
409
-
410
-
411
-
412
-
413
-
414
-
415
-
416
-
417
-
418
-
419
-
420
-
421
-
422
-
423
-
424
-
425
-
426
-
427
-
428
-
429
-
430
-
431
-
432
-
433
-
434
-
435
-
436
-
437
-
438
-
439
-
440
 |
 |

95
Overview Operating & Financial Review Corporate Governance Financial Statements Shareholder Information
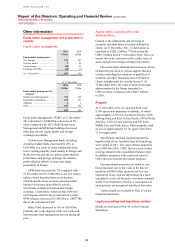
Accounting for deferred bonus arrangements
Recent regulatory and best practice guidance has
clarified the required structure and terms of deferred
bonus arrangements awarded to employees, who
now have a better understanding of the likely nature
of awards to be granted in respect of a particular
financial year. As a result, the vesting period in
respect of deferred awards expected to be granted in
March 2012 is therefore determined to have started
on 1 January 2011. An additional expense of
US$163m in respect of these deferred awards was
recognised in ‘Operating expenses’ during 2011.
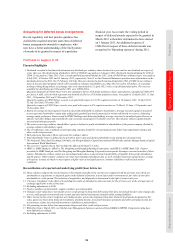
Footnotes to pages 2 to 93
Financial highlights
1 Dividends recorded in the financial statements are dividends per ordinary share declared in a year and are not dividends in respect of,
or for, that year. The third interim dividend for 2010 of US$0.08 was paid on 12 January 2011. The fourth interim dividend for 2010 of
US$0.12 was paid on 5 May 2011. First, second and third interim dividends for 2011, each of US$0.09 per ordinary share, were paid on
6 July 2011, 6 October 2011 and 18 January 2012, respectively. Note 11 on the Financial Statements provides more information on the
dividends declared in 2011. On 27 February 2012 the Directors declared a fourth interim dividend for 2011 of US$0.14 per ordinary
share in lieu of a final dividend, which will be payable to ordinary shareholders on 2 May 2012 in cash in US dollars, or in pounds
sterling or Hong Kong dollars at exchange rates to be determined on 23 April 2012, with a scrip dividend alternative. The reserves
available for distribution at 31 December 2011 were US$34,621m.
Quarterly dividends of US$15.50 per 6.2% non-cumulative Series A US dollar preference share, equivalent to a dividend of US$0.3875
per Series A ADS, each of which represents one-fortieth of a Series A US dollar preference share, were paid on 15 March 2011, 15 June
2011, 15 September 2011 and 15 December 2011.
Quarterly coupons of US$0.508 per security were paid with respect to 8.125% capital securities on 18 January 2011, 15 April 2011,
15 July 2011 and 15 October 2011.
Quarterly coupons of US$0.50 per security were paid with respect to 8% capital securities on 15 March, 15 June, 15 September and
15 December 2011.
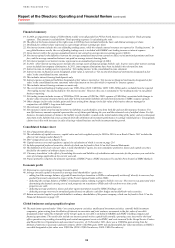
2 Return on average invested capital is based on the profit attributable to ordinary shareholders. Average invested capital is measured
as average total shareholders’ equity after adding back goodwill previously amortised or written-off directly to reserves, deducting
average equity preference shares issued by HSBC Holdings and deducting/(adding) average reserves for unrealised gains/(losses) on
effective cash flow hedges and available-for-sale securities and property revaluation reserves. This measure reflects capital initially
invested and subsequent profit.
3 The return on average ordinary shareholders’ equity is defined as profit attributable to shareholders of the parent company divided by
average ordinary shareholders’ equity.
4 The cost efficiency ratio is defined as total operating expenses divided by net operating income before loan impairment charges and
other credit risk provisions.
5 Each American Depositary Share represents five ordinary shares.
6 Total shareholder return is defined as the growth in share value and declared dividend income during the relevant period.
7 The Financial Times Stock Exchange 100 Index, the Morgan Stanley Capital International World Index and the Morgan Stanley Capital
International World Bank Index.
8 The core tier 1 capital ratio in 2011 includes the effect of the Basel 2.5 rules.
9 HBEU is HSBC Bank plc; HBAP is The Hongkong and Shanghai Banking Corporation; and HBUS is HSBC Bank USA. Figures
provided for HSBC Bank plc and The Hongkong and Shanghai Banking Corporation incorporate the major overseas branches of these
entities. Subsidiaries of these entities are not included unless there is unrestricted transferability of liquidity between the subsidiaries
and the parent. ‘Other entities’ comprise our other main banking subsidiaries and, as such, includes businesses spread across a range
of locations, in many of which we may require a higher ratio of net liquid assets to customer liabilities to reflect local market
conditions.
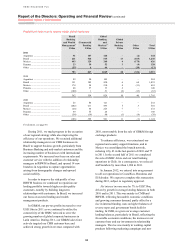
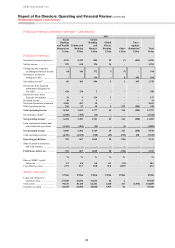
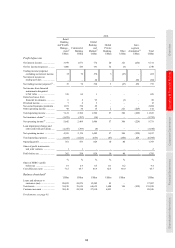
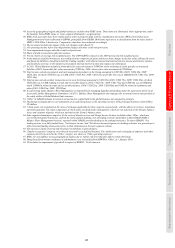
Reconciliations of reported and underlying profit/(loss) before tax
10 These columns comprise the net increments or decrements in profits in the current year compared with the previous year which are
attributable to acquisitions or disposals gains on the dilution of interests in associates and/or movements in fair value of own debt
attributable to credit spread. The inclusion of acquisitions and disposals is determined in the light of events each year.
11 ‘Currency translation’ is the effect of translating the results of subsidiaries and associates for the previous year at the average rates of
exchange applicable in the current year.
12 Excluding adjustments in 2010.
13 Positive numbers are favourable: negative numbers are unfavourable.
14 Changes in fair value due to movements in own credit spread on long-term debt issued. This does not include the fair value changes due
to own credit spread on structured notes issued and other hybrid instruments included within trading liabilities.
15 Other income in this context comprises net trading income, net income/(expense) from other financial instruments designated at fair
value, gains less losses from financial investments, dividend income, net earned insurance premiums and other operating income less
net insurance claims incurred and movement in liabilities to policyholders.
16 Net operating income before loan impairment charges and other credit risk provisions.
17 With effect from 1 March 2011, our Global Asset Management business was moved from GB&M to RBWM. Comparative data have
been adjusted accordingly.
18 Excluding adjustments in 2009.