HSBC 2011 Annual Report Download - page 323
Download and view the complete annual report
Please find page 323 of the 2011 HSBC annual report below. You can navigate through the pages in the report by either clicking on the pages listed below, or by using the keyword search tool below to find specific information within the annual report.-
 1
1 -
2
-
3
-
4
-
5
-
6
-
7
-
8
-
9
-
10
-
11
-
12
-
13
-
14
-
15
-
16
-
17
-
18
-
19
-
20
-
21
-
22
-
23
-
24
-
25
-
26
-
27
-
28
-
29
-
30
-
31
-
32
-
33
-
34
-
35
-
36
-
37
-
38
-
39
-
40
-
41
-
42
-
43
-
44
-
45
-
46
-
47
-
48
-
49
-
50
-
51
-
52
-
53
-
54
-
55
-
56
-
57
-
58
-
59
-
60
-
61
-
62
-
63
-
64
-
65
-
66
-
67
-
68
-
69
-
70
-
71
-
72
-
73
-
74
-
75
-
76
-
77
-
78
-
79
-
80
-
81
-
82
-
83
-
84
-
85
-
86
-
87
-
88
-
89
-
90
-
91
-
92
-
93
-
94
-
95
-
96
-
97
-
98
-
99
-
100
-
101
-
102
-
103
-
104
-
105
-
106
-
107
-
108
-
109
-
110
-
111
-
112
-
113
-
114
-
115
-
116
-
117
-
118
-
119
-
120
-
121
-
122
-
123
-
124
-
125
-
126
-
127
-
128
-
129
-
130
-
131
-
132
-
133
-
134
-
135
-
136
-
137
-
138
-
139
-
140
-
141
-
142
-
143
-
144
-
145
-
146
-
147
-
148
-
149
-
150
-
151
-
152
-
153
-
154
-
155
-
156
-
157
-
158
-
159
-
160
-
161
-
162
-
163
-
164
-
165
-
166
-
167
-
168
-
169
-
170
-
171
-
172
-
173
-
174
-
175
-
176
-
177
-
178
-
179
-
180
-
181
-
182
-
183
-
184
-
185
-
186
-
187
-
188
-
189
-
190
-
191
-
192
-
193
-
194
-
195
-
196
-
197
-
198
-
199
-
200
-
201
-
202
-
203
-
204
-
205
-
206
-
207
-
208
-
209
-
210
-
211
-
212
-
213
-
214
-
215
-
216
-
217
-
218
-
219
-
220
-
221
-
222
-
223
-
224
-
225
-
226
-
227
-
228
-
229
-
230
-
231
-
232
-
233
-
234
-
235
-
236
-
237
-
238
-
239
-
240
-
241
-
242
-
243
-
244
-
245
-
246
-
247
-
248
-
249
-
250
-
251
-
252
-
253
-
254
-
255
-
256
-
257
-
258
-
259
-
260
-
261
-
262
-
263
-
264
-
265
-
266
-
267
-
268
-
269
-
270
-
271
-
272
-
273
-
274
-
275
-
276
-
277
-
278
-
279
-
280
-
281
-
282
-
283
-
284
-
285
-
286
-
287
-
288
-
289
-
290
-
291
-
292
-
293
-
294
-
295
-
296
-
297
-
298
-
299
-
300
-
301
-
302
-
303
-
304
-
305
-
306
-
307
-
308
-
309
-
310
-
311
-
312
-
 313
313 -
 314
314 -
 315
315 -
 316
316 -
 317
317 -
 318
318 -
 319
319 -
 320
320 -
 321
321 -
 322
322 -
 323
323 -
 324
324 -
 325
325 -
 326
326 -
 327
327 -
 328
328 -
 329
329 -
 330
330 -
 331
331 -
 332
332 -
 333
333 -
334
-
335
-
336
-
337
-
338
-
339
-
340
-
341
-
342
-
343
-
344
-
345
-
346
-
347
-
348
-
349
-
350
-
351
-
352
-
353
-
354
-
355
-
356
-
357
-
358
-
359
-
360
-
361
-
362
-
363
-
364
-
365
-
366
-
367
-
368
-
369
-
370
-
371
-
372
-
373
-
374
-
375
-
376
-
377
-
378
-
379
-
380
-
381
-
382
-
383
-
384
-
385
-
386
-
387
-
388
-
389
-
390
-
391
-
392
-
393
-
394
-
395
-
396
-
397
-
398
-
399
-
400
-
401
-
402
-
403
-
404
-
405
-
406
-
407
-
408
-
409
-
410
-
411
-
412
-
413
-
414
-
415
-
416
-
417
-
418
-
419
-
420
-
421
-
422
-
423
-
424
-
425
-
426
-
427
-
428
-
429
-
430
-
431
-
432
-
433
-
434
-
435
-
436
-
437
-
438
-
439
-
440
 |
 |

321
Overview Operating & Financial Review Corporate Governance Financial Statements Shareholder Information
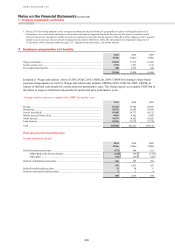
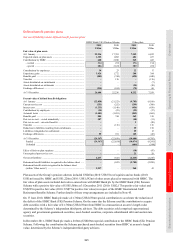
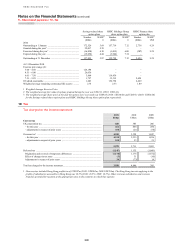
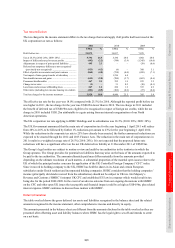
Defined benefit pension plans
Net asset/(liability) under defined benefit pension plans
HSBC Bank (UK) Pension Scheme Other plans
2011 2010 2011 2010
US$m US$m US$m US$m
Fair value of plan assets
At 1 January .................................................................................. 22,236 17,701 7,559 6,822
Expected return on plan assets ..................................................... 1,325 1,092 481 437
Contributions by HSBC ................................................................ 600 2,890 565 422
– normal .................................................................................... 314 252 176 194
– special .................................................................................... 286 2,638 389 228
Contributions by employees ......................................................... 34 23 22 17
Experience gains ........................................................................... 3,426 1,772 200 394
Benefits paid ................................................................................. (803) (744) (495) (440)
Transfers ....................................................................................... – 136 – (136)
Assets distributed on curtailments ................................................ – – – (7)
Assets distributed on settlements ................................................. – – (25) (10)
Exchange differences .................................................................... (214) (634) (75) 60
At 31 December ............................................................................ 26,604 22,236 8,232 7,559
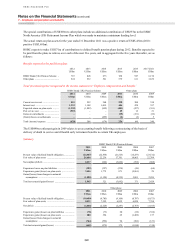
Present value of defined benefit obligations
At 1 January .................................................................................. (22,858) (21,523) (9,785) (9,109)
Current service cost ...................................................................... (251) (252) (299) (300)
Interest cost ................................................................................... (1,233) (1,148) (456) (438)
Contributions by employees ......................................................... (34) (23) (22) (17)
Actuarial losses ............................................................................. (1,481) (1,451) (842) (669)
Benefits paid ................................................................................. 804 744 569 518
Past service cost – vested immediately ........................................ 587 – (40) (11)
Past service cost – unvested benefits ............................................ – – 2 (20)
Transfers ....................................................................................... – (136) – 136
Reduction in liabilities resulting from curtailments ..................... – – 59 158
Liabilities extinguished on settlements ........................................ – – 29 12
Exchange differences .................................................................... 99 931 105 (45)
At 31 December ............................................................................ (24,367) (22,858) (10,680) (9,785)
Funded ...................................................................................... (24,367) (22,858) (10,074) (9,241)
Unfunded .................................................................................. ––(606) (544)
Effect of limit on plan surpluses ................................................... – – (18) (47)
Unrecognised past service cost ..................................................... – – 21 28
Net asset/(liability) ....................................................................... 2,237 (622) (2,445) (2,245)
Retirement benefit liabilities recognised in the balance sheet ..... – (622) (2,705) (2,288)
Retirement benefit assets recognised in the balance sheet
(within ‘Other assets’) .............................................................. 2,237 – 260 43
Plan assets of the Group’s pension schemes included US$45m (2010: US$57m) of equities and no bonds (2010:
US$1m) issued by HSBC and US$1,228m (2010: US$1,592m) of other assets placed or transacted with HSBC. The
fair value of plan assets included derivatives entered into with HSBC Bank plc by the HSBC Bank (UK) Pension
Scheme with a positive fair value of US$5,560m at 31 December 2011 (2010: US$2,173m positive fair value) and
US$297m positive fair value (2010: US$77m positive fair value) in respect of the HSBC International Staff
Retirement Benefits Scheme. Further details of these swap arrangements are included in Note 45.
On 17 June 2010, HSBC Bank plc made a £1,760m (US$2,638m) special contribution to accelerate the reduction of
the deficit of the HSBC Bank (UK) Pension Scheme. On the same day the Scheme used the contribution to acquire
debt securities with a fair value of £1,760m (US$2,638m) from HSBC in a transaction at an arm’s length value
determined by the Scheme’s independent third-party advisers. The debt securities sold comprised supra-national,
agency and government-guaranteed securities, asset-backed securities, corporate subordinated debt and auction rate
securities.
In December 2011, HSBC Bank plc made a £184m (US$286m) special contribution to the HSBC Bank (UK) Pension
Scheme. Following the contribution the Scheme purchased asset-backed securities from HSBC at an arm’s length
value, determined by the Scheme’s independent third-party advisers.