HSBC 2011 Annual Report Download - page 161
Download and view the complete annual report
Please find page 161 of the 2011 HSBC annual report below. You can navigate through the pages in the report by either clicking on the pages listed below, or by using the keyword search tool below to find specific information within the annual report.-
 1
1 -
2
-
3
-
4
-
5
-
6
-
7
-
8
-
9
-
10
-
11
-
12
-
13
-
14
-
15
-
16
-
17
-
18
-
19
-
20
-
21
-
22
-
23
-
24
-
25
-
26
-
27
-
28
-
29
-
30
-
31
-
32
-
33
-
34
-
35
-
36
-
37
-
38
-
39
-
40
-
41
-
42
-
43
-
44
-
45
-
46
-
47
-
48
-
49
-
50
-
51
-
52
-
53
-
54
-
55
-
56
-
57
-
58
-
59
-
60
-
61
-
62
-
63
-
64
-
65
-
66
-
67
-
68
-
69
-
70
-
71
-
72
-
73
-
74
-
75
-
76
-
77
-
78
-
79
-
80
-
81
-
82
-
83
-
84
-
85
-
86
-
87
-
88
-
89
-
90
-
91
-
92
-
93
-
94
-
95
-
96
-
97
-
98
-
99
-
100
-
101
-
102
-
103
-
104
-
105
-
106
-
107
-
108
-
109
-
110
-
111
-
112
-
113
-
114
-
115
-
116
-
117
-
118
-
119
-
120
-
121
-
122
-
123
-
124
-
125
-
126
-
127
-
128
-
129
-
130
-
131
-
132
-
133
-
134
-
135
-
136
-
137
-
138
-
139
-
140
-
141
-
142
-
143
-
144
-
145
-
146
-
147
-
148
-
149
-
150
-
 151
151 -
 152
152 -
 153
153 -
 154
154 -
 155
155 -
 156
156 -
 157
157 -
 158
158 -
 159
159 -
 160
160 -
 161
161 -
 162
162 -
 163
163 -
 164
164 -
 165
165 -
 166
166 -
 167
167 -
 168
168 -
 169
169 -
 170
170 -
 171
171 -
172
-
173
-
174
-
175
-
176
-
177
-
178
-
179
-
180
-
181
-
182
-
183
-
184
-
185
-
186
-
187
-
188
-
189
-
190
-
191
-
192
-
193
-
194
-
195
-
196
-
197
-
198
-
199
-
200
-
201
-
202
-
203
-
204
-
205
-
206
-
207
-
208
-
209
-
210
-
211
-
212
-
213
-
214
-
215
-
216
-
217
-
218
-
219
-
220
-
221
-
222
-
223
-
224
-
225
-
226
-
227
-
228
-
229
-
230
-
231
-
232
-
233
-
234
-
235
-
236
-
237
-
238
-
239
-
240
-
241
-
242
-
243
-
244
-
245
-
246
-
247
-
248
-
249
-
250
-
251
-
252
-
253
-
254
-
255
-
256
-
257
-
258
-
259
-
260
-
261
-
262
-
263
-
264
-
265
-
266
-
267
-
268
-
269
-
270
-
271
-
272
-
273
-
274
-
275
-
276
-
277
-
278
-
279
-
280
-
281
-
282
-
283
-
284
-
285
-
286
-
287
-
288
-
289
-
290
-
291
-
292
-
293
-
294
-
295
-
296
-
297
-
298
-
299
-
300
-
301
-
302
-
303
-
304
-
305
-
306
-
307
-
308
-
309
-
310
-
311
-
312
-
313
-
314
-
315
-
316
-
317
-
318
-
319
-
320
-
321
-
322
-
323
-
324
-
325
-
326
-
327
-
328
-
329
-
330
-
331
-
332
-
333
-
334
-
335
-
336
-
337
-
338
-
339
-
340
-
341
-
342
-
343
-
344
-
345
-
346
-
347
-
348
-
349
-
350
-
351
-
352
-
353
-
354
-
355
-
356
-
357
-
358
-
359
-
360
-
361
-
362
-
363
-
364
-
365
-
366
-
367
-
368
-
369
-
370
-
371
-
372
-
373
-
374
-
375
-
376
-
377
-
378
-
379
-
380
-
381
-
382
-
383
-
384
-
385
-
386
-
387
-
388
-
389
-
390
-
391
-
392
-
393
-
394
-
395
-
396
-
397
-
398
-
399
-
400
-
401
-
402
-
403
-
404
-
405
-
406
-
407
-
408
-
409
-
410
-
411
-
412
-
413
-
414
-
415
-
416
-
417
-
418
-
419
-
420
-
421
-
422
-
423
-
424
-
425
-
426
-
427
-
428
-
429
-
430
-
431
-
432
-
433
-
434
-
435
-
436
-
437
-
438
-
439
-
440
 |
 |

159
Overview Operating & Financial Review Corporate Governance Financial Statements Shareholder Information
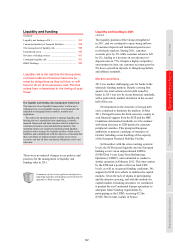
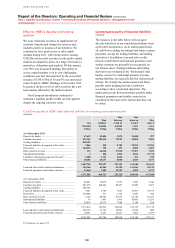
Cash flows payable in respect of customer
accounts are primarily contractually repayable on
demand or at short notice. However, in practice,
short-term deposit balances remain stable as inflows
and outflows broadly match and a significant portion
of loan commitments expire without being drawn
upon. We therefore manage our balance sheet on
both contractual and behaviouralised bases. Each
operating entity determines the behaviouralisation
of its products within the guidelines set out in our
liquidity framework and as approved by its ALCO.
Although on a contractual basis 86% of
our liabilities are due within one year, only
approximately half of our behaviouralised liabilities
are expected to fall due within this one-year period.
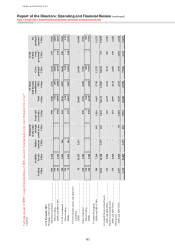
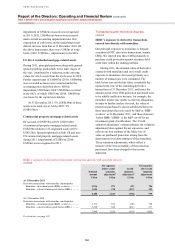
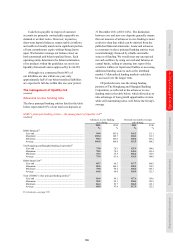
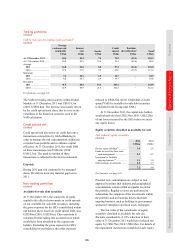
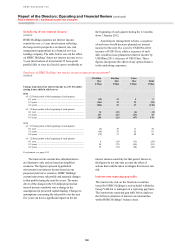
The management of liquidity risk
(Audited)
Advances to core funding ratio
The three principal banking entities listed in the table
below represented 61% of our total core deposits at
31 December 2011 (2010: 62%). The distinction
between core and non-core deposits generally means
that our measure of advances to core funding is more
restrictive than that which can be inferred from the
published financial statements. Loans and advances
to customers in these principal banking entities were
overwhelmingly financed by reliable and stable
sources of funding. We would meet any unexpected
net cash outflows by using our cash and balances at
central banks, selling or entering into repos of the
securities within our liquid asset buffers or accessing
additional funding sources such as the interbank
market. Collateralised lending markets could also
be accessed over the longer term.
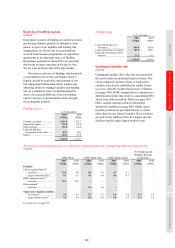
Of particular note was the strong funding
position of The Hongkong and Shanghai Banking
Corporation, as reflected in the advances to core
funding ratio in the table below, which allowed us to
take advantage of loan growth opportunities in Asia
while still maintaining ratios well below the Group’s
average.
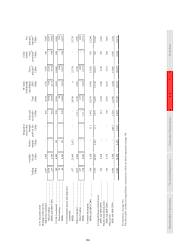
HSBC’s principal banking entities – the management of liquidity risk44
(Audited)
Advances to core funding
ratio during:
Stressed one month coverage
ratio during:
2011 2010 2011 2010
% % % %
HSBC Bank plc45
Year-end ................................................................................... 99.8 103.0 116.2 111.1
Maximum ................................................................................ 103.4 109.7 118.1 111.3
Minimum ................................................................................. 98.4 102.6 109.4 103.2
Average .................................................................................... 100.8 106.0 112.5 108.2
The Hongkong and Shanghai Banking Corporation45
Year-end ................................................................................... 75.0 70.3 122.9 144.6
Maximum ................................................................................ 78.9 70.3 144.6 165.4
Minimum ................................................................................. 70.3 55.5 116.4 132.6
Average .................................................................................... 75.9 63.6 124.0 148.8
HSBC Bank USA46
Year-end ................................................................................... 85.7 98.3 117.7 108.5
Maximum ................................................................................ 89.5 104.3 128.3 118.5
Minimum ................................................................................. 79.8 94.2 108.5 105.3
Average .................................................................................... 84.6 98.0 118.9 112.3
Total of HSBC’s other principal banking entities47
Year-end ................................................................................... 86.4 89.1 117.6 119.6
Maximum ................................................................................ 90.2 89.1 120.4 126.5
Minimum ................................................................................. 86.4 85.7 116.2 118.1
Average .................................................................................... 88.9 87.0 117.9 122.2
For footnotes, see page 185.