HSBC 2011 Annual Report Download - page 184
Download and view the complete annual report
Please find page 184 of the 2011 HSBC annual report below. You can navigate through the pages in the report by either clicking on the pages listed below, or by using the keyword search tool below to find specific information within the annual report.-
 1
1 -
2
-
3
-
4
-
5
-
6
-
7
-
8
-
9
-
10
-
11
-
12
-
13
-
14
-
15
-
16
-
17
-
18
-
19
-
20
-
21
-
22
-
23
-
24
-
25
-
26
-
27
-
28
-
29
-
30
-
31
-
32
-
33
-
34
-
35
-
36
-
37
-
38
-
39
-
40
-
41
-
42
-
43
-
44
-
45
-
46
-
47
-
48
-
49
-
50
-
51
-
52
-
53
-
54
-
55
-
56
-
57
-
58
-
59
-
60
-
61
-
62
-
63
-
64
-
65
-
66
-
67
-
68
-
69
-
70
-
71
-
72
-
73
-
74
-
75
-
76
-
77
-
78
-
79
-
80
-
81
-
82
-
83
-
84
-
85
-
86
-
87
-
88
-
89
-
90
-
91
-
92
-
93
-
94
-
95
-
96
-
97
-
98
-
99
-
100
-
101
-
102
-
103
-
104
-
105
-
106
-
107
-
108
-
109
-
110
-
111
-
112
-
113
-
114
-
115
-
116
-
117
-
118
-
119
-
120
-
121
-
122
-
123
-
124
-
125
-
126
-
127
-
128
-
129
-
130
-
131
-
132
-
133
-
134
-
135
-
136
-
137
-
138
-
139
-
140
-
141
-
142
-
143
-
144
-
145
-
146
-
147
-
148
-
149
-
150
-
151
-
152
-
153
-
154
-
155
-
156
-
157
-
158
-
159
-
160
-
161
-
162
-
163
-
164
-
165
-
166
-
167
-
168
-
169
-
170
-
171
-
172
-
173
-
 174
174 -
 175
175 -
 176
176 -
 177
177 -
 178
178 -
 179
179 -
 180
180 -
 181
181 -
 182
182 -
 183
183 -
 184
184 -
 185
185 -
 186
186 -
 187
187 -
 188
188 -
 189
189 -
 190
190 -
 191
191 -
 192
192 -
 193
193 -
 194
194 -
195
-
196
-
197
-
198
-
199
-
200
-
201
-
202
-
203
-
204
-
205
-
206
-
207
-
208
-
209
-
210
-
211
-
212
-
213
-
214
-
215
-
216
-
217
-
218
-
219
-
220
-
221
-
222
-
223
-
224
-
225
-
226
-
227
-
228
-
229
-
230
-
231
-
232
-
233
-
234
-
235
-
236
-
237
-
238
-
239
-
240
-
241
-
242
-
243
-
244
-
245
-
246
-
247
-
248
-
249
-
250
-
251
-
252
-
253
-
254
-
255
-
256
-
257
-
258
-
259
-
260
-
261
-
262
-
263
-
264
-
265
-
266
-
267
-
268
-
269
-
270
-
271
-
272
-
273
-
274
-
275
-
276
-
277
-
278
-
279
-
280
-
281
-
282
-
283
-
284
-
285
-
286
-
287
-
288
-
289
-
290
-
291
-
292
-
293
-
294
-
295
-
296
-
297
-
298
-
299
-
300
-
301
-
302
-
303
-
304
-
305
-
306
-
307
-
308
-
309
-
310
-
311
-
312
-
313
-
314
-
315
-
316
-
317
-
318
-
319
-
320
-
321
-
322
-
323
-
324
-
325
-
326
-
327
-
328
-
329
-
330
-
331
-
332
-
333
-
334
-
335
-
336
-
337
-
338
-
339
-
340
-
341
-
342
-
343
-
344
-
345
-
346
-
347
-
348
-
349
-
350
-
351
-
352
-
353
-
354
-
355
-
356
-
357
-
358
-
359
-
360
-
361
-
362
-
363
-
364
-
365
-
366
-
367
-
368
-
369
-
370
-
371
-
372
-
373
-
374
-
375
-
376
-
377
-
378
-
379
-
380
-
381
-
382
-
383
-
384
-
385
-
386
-
387
-
388
-
389
-
390
-
391
-
392
-
393
-
394
-
395
-
396
-
397
-
398
-
399
-
400
-
401
-
402
-
403
-
404
-
405
-
406
-
407
-
408
-
409
-
410
-
411
-
412
-
413
-
414
-
415
-
416
-
417
-
418
-
419
-
420
-
421
-
422
-
423
-
424
-
425
-
426
-
427
-
428
-
429
-
430
-
431
-
432
-
433
-
434
-
435
-
436
-
437
-
438
-
439
-
440
 |
 |

HSBC HOLDINGS PLC
Report of the Directors: Operating and Financial Review (continued)
Risk > Insurance risk > Economic assumptions / Non-economic assumptions // Other material risks > Reputational risk
182
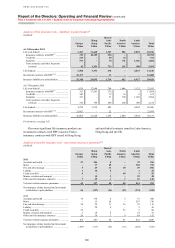
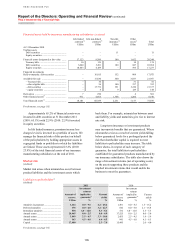
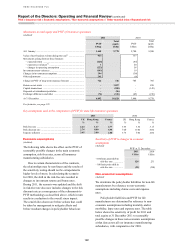
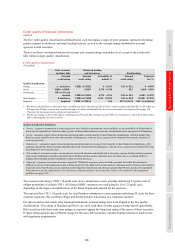
Movements in total equity and PVIF of insurance operations
(Audited)
2011 2010
PVIF
Total
equity
PVIF
Total
equity
US$m US$m US$m US$m
At 1 January .................................................................................. 3,440 9,778 2,780 8,580
Value of new business written during the year81 .......................... 943 737
Movements arising from in-force business:
– expected return ...................................................................... (428) (85)
– experience variances82 ........................................................... 1 20
– changes in operating assumptions ......................................... (222) 58
Investment return variances .......................................................... (103) 19
Changes in investment assumptions ............................................. 294 (38)
Other adjustments ......................................................................... 241 (6)
Change in PVIF of long-term insurance business ........................ 726 726 705 705
Return on net assets ...................................................................... – 1,057 – 858
Capital transactions ...................................................................... – (500) – (149)
Disposals of subsidiaries/portfolios ............................................. – (96) – –
Exchange differences and other ................................................... (74) (336) (45) (216)
At 31 December ............................................................................ 4,092 10,629 3,440 9,778
For footnotes, see page 185.
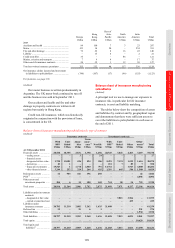
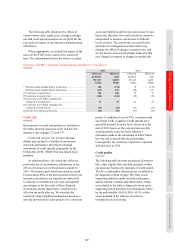
Key assumptions used in the computation of PVIF for main life insurance operations
2011 2010
UK Hong Kong France UK Hong Kong France
% % % % % %
Risk free rate .......................................................... 2.24 1.47
2.77 3.46 3.10 3.15
Risk discount rate .................................................. 2.74 8.00
5.95 7.00 11.00 8.00
Expense inflation ................................................... 3.45 3.00
2.00 3.76 3.00 2.00
Economic assumptions
(Audited)
The following table shows the effect on the PVIF of
reasonably possible changes in the main economic
assumption, risk-free rates, across all insurance
manufacturing subsidiaries.
Due to certain characteristics of the contracts,
the relationships may be non-linear and the results of
the sensitivity testing should not be extrapolated to
higher levels of stress. In calculating the scenario
for 2010, the shift in the risk-free rate resulted in
changes to investment returns and bonus rates.
During 2011, the scenario was updated and the shift
in risk-free rate also now includes changes to the risk
discount rate as a consequence of the refinements to
PVIF methodology as described above, which in turn
results in a reduction to the overall stress impact.
The sensitivities shown are before actions that could
be taken by management to mitigate effects and
before resultant changes in policyholder behaviour.
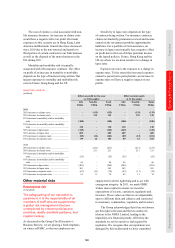
Sensitivity of PVIF to changes in economic
assumptions
(Audited)
PVIF at 31 December
2011 2010
US$m US$m
+ 100 basis point shift in
risk-free rate ................ 128 231
– 100 basis point shift in
risk-free rate ................ (91) (190)
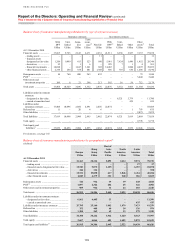
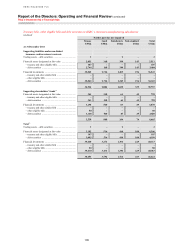
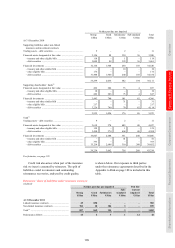
Non-economic assumptions
(Audited)
We determine the policyholder liabilities for non-life
manufacturers by reference to non-economic
assumptions including claims costs and expense
rates.
Policyholder liabilities and PVIF for life
manufacturers are determined by reference to non-
economic assumptions including mortality and/or
morbidity, lapse rates and expense rates. The table
below shows the sensitivity of profit for 2011 and
total equity at 31 December 2011 to reasonably
possible changes in these non-economic assumptions
at that date across all our insurance manufacturing
subsidiaries, with comparatives for 2010.