HSBC 2011 Annual Report Download - page 159
Download and view the complete annual report
Please find page 159 of the 2011 HSBC annual report below. You can navigate through the pages in the report by either clicking on the pages listed below, or by using the keyword search tool below to find specific information within the annual report.-
 1
1 -
2
-
3
-
4
-
5
-
6
-
7
-
8
-
9
-
10
-
11
-
12
-
13
-
14
-
15
-
16
-
17
-
18
-
19
-
20
-
21
-
22
-
23
-
24
-
25
-
26
-
27
-
28
-
29
-
30
-
31
-
32
-
33
-
34
-
35
-
36
-
37
-
38
-
39
-
40
-
41
-
42
-
43
-
44
-
45
-
46
-
47
-
48
-
49
-
50
-
51
-
52
-
53
-
54
-
55
-
56
-
57
-
58
-
59
-
60
-
61
-
62
-
63
-
64
-
65
-
66
-
67
-
68
-
69
-
70
-
71
-
72
-
73
-
74
-
75
-
76
-
77
-
78
-
79
-
80
-
81
-
82
-
83
-
84
-
85
-
86
-
87
-
88
-
89
-
90
-
91
-
92
-
93
-
94
-
95
-
96
-
97
-
98
-
99
-
100
-
101
-
102
-
103
-
104
-
105
-
106
-
107
-
108
-
109
-
110
-
111
-
112
-
113
-
114
-
115
-
116
-
117
-
118
-
119
-
120
-
121
-
122
-
123
-
124
-
125
-
126
-
127
-
128
-
129
-
130
-
131
-
132
-
133
-
134
-
135
-
136
-
137
-
138
-
139
-
140
-
141
-
142
-
143
-
144
-
145
-
146
-
147
-
148
-
 149
149 -
 150
150 -
 151
151 -
 152
152 -
 153
153 -
 154
154 -
 155
155 -
 156
156 -
 157
157 -
 158
158 -
 159
159 -
 160
160 -
 161
161 -
 162
162 -
 163
163 -
 164
164 -
 165
165 -
 166
166 -
 167
167 -
 168
168 -
 169
169 -
170
-
171
-
172
-
173
-
174
-
175
-
176
-
177
-
178
-
179
-
180
-
181
-
182
-
183
-
184
-
185
-
186
-
187
-
188
-
189
-
190
-
191
-
192
-
193
-
194
-
195
-
196
-
197
-
198
-
199
-
200
-
201
-
202
-
203
-
204
-
205
-
206
-
207
-
208
-
209
-
210
-
211
-
212
-
213
-
214
-
215
-
216
-
217
-
218
-
219
-
220
-
221
-
222
-
223
-
224
-
225
-
226
-
227
-
228
-
229
-
230
-
231
-
232
-
233
-
234
-
235
-
236
-
237
-
238
-
239
-
240
-
241
-
242
-
243
-
244
-
245
-
246
-
247
-
248
-
249
-
250
-
251
-
252
-
253
-
254
-
255
-
256
-
257
-
258
-
259
-
260
-
261
-
262
-
263
-
264
-
265
-
266
-
267
-
268
-
269
-
270
-
271
-
272
-
273
-
274
-
275
-
276
-
277
-
278
-
279
-
280
-
281
-
282
-
283
-
284
-
285
-
286
-
287
-
288
-
289
-
290
-
291
-
292
-
293
-
294
-
295
-
296
-
297
-
298
-
299
-
300
-
301
-
302
-
303
-
304
-
305
-
306
-
307
-
308
-
309
-
310
-
311
-
312
-
313
-
314
-
315
-
316
-
317
-
318
-
319
-
320
-
321
-
322
-
323
-
324
-
325
-
326
-
327
-
328
-
329
-
330
-
331
-
332
-
333
-
334
-
335
-
336
-
337
-
338
-
339
-
340
-
341
-
342
-
343
-
344
-
345
-
346
-
347
-
348
-
349
-
350
-
351
-
352
-
353
-
354
-
355
-
356
-
357
-
358
-
359
-
360
-
361
-
362
-
363
-
364
-
365
-
366
-
367
-
368
-
369
-
370
-
371
-
372
-
373
-
374
-
375
-
376
-
377
-
378
-
379
-
380
-
381
-
382
-
383
-
384
-
385
-
386
-
387
-
388
-
389
-
390
-
391
-
392
-
393
-
394
-
395
-
396
-
397
-
398
-
399
-
400
-
401
-
402
-
403
-
404
-
405
-
406
-
407
-
408
-
409
-
410
-
411
-
412
-
413
-
414
-
415
-
416
-
417
-
418
-
419
-
420
-
421
-
422
-
423
-
424
-
425
-
426
-
427
-
428
-
429
-
430
-
431
-
432
-
433
-
434
-
435
-
436
-
437
-
438
-
439
-
440
 |
 |

157
Overview Operating & Financial Review Corporate Governance Financial Statements Shareholder Information
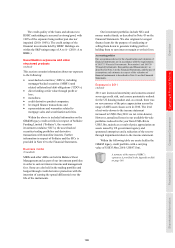
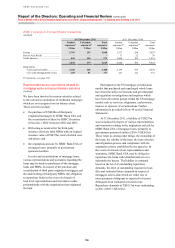
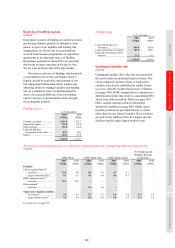
Liquidity and funding
(Audited)
Liquidity and funding in 2011 ........................................ 157
Contractual maturity of financial liabilities ................... 158
The management of liquidity risk .................................. 159
Encumbered assets .......................................................... 160
Diversity of funding sources .......................................... 161
Contingent liquidity risk ................................................. 161
HSBC Holdings .............................................................. 162
Liquidity risk is the risk that the Group does
not have sufficient financial resources to
meet its obligations as they fall due, or will
have to do so at an excessive cost. The risk
arises from mismatches in the timing of cash
flows.
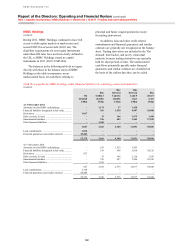
Our liquidity and funding risk management framework
The objective of our liquidity framework is to allow us to
withstand very severe liquidity stresses. It is designed to be
adaptable to changing business models, markets and
regulations.
We expect our operating entities to manage liquidity and
funding risk on a standalone basis employing a centrally
imposed framework and limit structure which is adapted to
variations in business mix and underlying markets. Our
operating entities are required to maintain strong liquidity
positions and to manage the liquidity profiles of their assets,
liabilities and commitments with the objective of ensuring that
their cash flows are balanced under various severe stress
scenarios and that all their anticipated obligations can be met
when due.
There were no material changes to our policies and
practices for the management of liquidity and
funding risks in 2011.
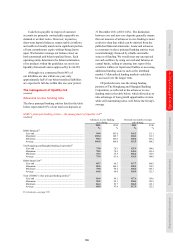
A summary of our current policies and practices
regarding liquidity and funding is provided in the
Appendix to Risk on page 188.
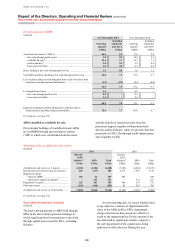
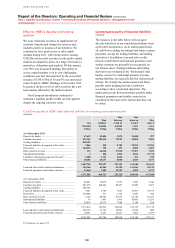
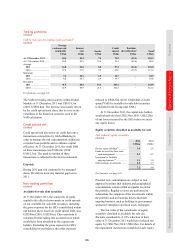
Liquidity and funding in 2011
(Audited)
The liquidity position of the Group strengthened
in 2011, and we continued to enjoy strong inflows
of customer deposits and maintained good access
to wholesale markets. During 2011, customer
accounts grew by 2% while customer advances fell
by 2%, leading to a decrease in our advances-to-
deposits ratio to 75%. Despite a highly competitive
environment in Asia, our customer accounts grew by
8% due to growth in deposits in Hong Kong dollars
and offshore renminbi.
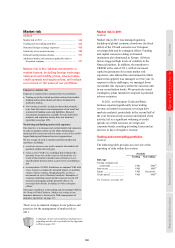
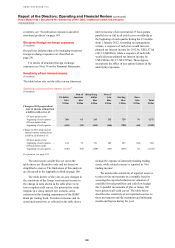
Market conditions
2011 was another challenging year for banks in the
wholesale funding markets. Despite a strong first
quarter, the total volume of term debt issued by
banks in 2011 was low by recent historical standards,
with a particularly marked slowdown in the second
half of the year.
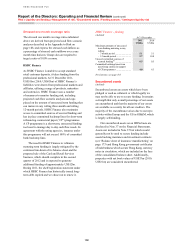
Developments in the eurozone sovereign debt
crisis continued to dominate the markets. In May
2011, Portugal became the third eurozone country to
seek financial support from the ECB and the IMF.
Conditions deteriorated markedly over the summer
with sharp increases in CDS premia for eurozone
peripheral countries. This prompted European
authorities to propose a package of measures in
October including a near doubling of the capacity
of the European Financial Stability Facility.
In December, with the crisis reaching systemic
levels, the ECB injected liquidity into the European
banking sector via an unprecedented €489bn
(US$632bn) 3-year Long-Term Refinancing
Operation (‘LTRO’), and committed to conduct a
similar operation in February 2012. This intervention
by the ECB had a positive effect on bank CDS
levels, as well as on general funding conditions. We
support the ECB in its efforts to stabilise the capital
markets. Given the lack of stigma in participating
and the attractive pricing, and with the outlook for
capital markets remaining uncertain, we considered
it prudent for our Continental Europe operations to
anticipate future funding requirements by
participating in the LTRO, receiving €5.2bn
(US$6.7bn) in total, mainly in France.