HSBC 2011 Annual Report Download - page 167
Download and view the complete annual report
Please find page 167 of the 2011 HSBC annual report below. You can navigate through the pages in the report by either clicking on the pages listed below, or by using the keyword search tool below to find specific information within the annual report.-
 1
1 -
2
-
3
-
4
-
5
-
6
-
7
-
8
-
9
-
10
-
11
-
12
-
13
-
14
-
15
-
16
-
17
-
18
-
19
-
20
-
21
-
22
-
23
-
24
-
25
-
26
-
27
-
28
-
29
-
30
-
31
-
32
-
33
-
34
-
35
-
36
-
37
-
38
-
39
-
40
-
41
-
42
-
43
-
44
-
45
-
46
-
47
-
48
-
49
-
50
-
51
-
52
-
53
-
54
-
55
-
56
-
57
-
58
-
59
-
60
-
61
-
62
-
63
-
64
-
65
-
66
-
67
-
68
-
69
-
70
-
71
-
72
-
73
-
74
-
75
-
76
-
77
-
78
-
79
-
80
-
81
-
82
-
83
-
84
-
85
-
86
-
87
-
88
-
89
-
90
-
91
-
92
-
93
-
94
-
95
-
96
-
97
-
98
-
99
-
100
-
101
-
102
-
103
-
104
-
105
-
106
-
107
-
108
-
109
-
110
-
111
-
112
-
113
-
114
-
115
-
116
-
117
-
118
-
119
-
120
-
121
-
122
-
123
-
124
-
125
-
126
-
127
-
128
-
129
-
130
-
131
-
132
-
133
-
134
-
135
-
136
-
137
-
138
-
139
-
140
-
141
-
142
-
143
-
144
-
145
-
146
-
147
-
148
-
149
-
150
-
151
-
152
-
153
-
154
-
155
-
156
-
 157
157 -
 158
158 -
 159
159 -
 160
160 -
 161
161 -
 162
162 -
 163
163 -
 164
164 -
 165
165 -
 166
166 -
 167
167 -
 168
168 -
 169
169 -
 170
170 -
 171
171 -
 172
172 -
 173
173 -
 174
174 -
 175
175 -
 176
176 -
 177
177 -
178
-
179
-
180
-
181
-
182
-
183
-
184
-
185
-
186
-
187
-
188
-
189
-
190
-
191
-
192
-
193
-
194
-
195
-
196
-
197
-
198
-
199
-
200
-
201
-
202
-
203
-
204
-
205
-
206
-
207
-
208
-
209
-
210
-
211
-
212
-
213
-
214
-
215
-
216
-
217
-
218
-
219
-
220
-
221
-
222
-
223
-
224
-
225
-
226
-
227
-
228
-
229
-
230
-
231
-
232
-
233
-
234
-
235
-
236
-
237
-
238
-
239
-
240
-
241
-
242
-
243
-
244
-
245
-
246
-
247
-
248
-
249
-
250
-
251
-
252
-
253
-
254
-
255
-
256
-
257
-
258
-
259
-
260
-
261
-
262
-
263
-
264
-
265
-
266
-
267
-
268
-
269
-
270
-
271
-
272
-
273
-
274
-
275
-
276
-
277
-
278
-
279
-
280
-
281
-
282
-
283
-
284
-
285
-
286
-
287
-
288
-
289
-
290
-
291
-
292
-
293
-
294
-
295
-
296
-
297
-
298
-
299
-
300
-
301
-
302
-
303
-
304
-
305
-
306
-
307
-
308
-
309
-
310
-
311
-
312
-
313
-
314
-
315
-
316
-
317
-
318
-
319
-
320
-
321
-
322
-
323
-
324
-
325
-
326
-
327
-
328
-
329
-
330
-
331
-
332
-
333
-
334
-
335
-
336
-
337
-
338
-
339
-
340
-
341
-
342
-
343
-
344
-
345
-
346
-
347
-
348
-
349
-
350
-
351
-
352
-
353
-
354
-
355
-
356
-
357
-
358
-
359
-
360
-
361
-
362
-
363
-
364
-
365
-
366
-
367
-
368
-
369
-
370
-
371
-
372
-
373
-
374
-
375
-
376
-
377
-
378
-
379
-
380
-
381
-
382
-
383
-
384
-
385
-
386
-
387
-
388
-
389
-
390
-
391
-
392
-
393
-
394
-
395
-
396
-
397
-
398
-
399
-
400
-
401
-
402
-
403
-
404
-
405
-
406
-
407
-
408
-
409
-
410
-
411
-
412
-
413
-
414
-
415
-
416
-
417
-
418
-
419
-
420
-
421
-
422
-
423
-
424
-
425
-
426
-
427
-
428
-
429
-
430
-
431
-
432
-
433
-
434
-
435
-
436
-
437
-
438
-
439
-
440
 |
 |

165
Overview Operating & Financial Review Corporate Governance Financial Statements Shareholder Information
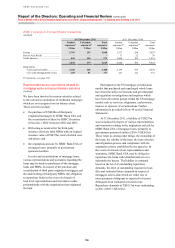
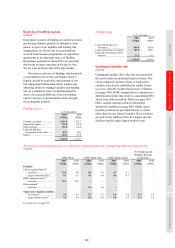
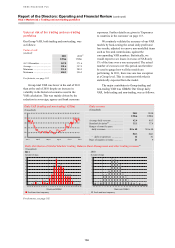
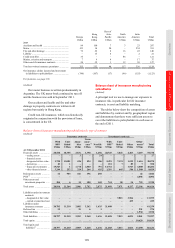
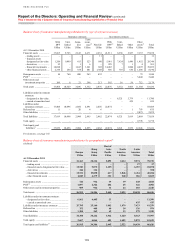
Trading portfolios
(Audited)
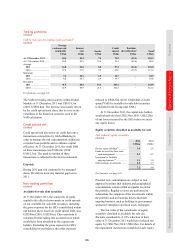
VAR by risk type for trading intent activities60
(Audited)
Foreign
exchange and
commodity
Interest
rate
Equity
Credit
spread
Portfolio
diversification61 Total62
US$m US$m US$m US$m US$m US$m
At 31 December 2011 ...... 18.6 49.4 7.4 75.2 (32.3) 118.3
At 31 December 2010 ....... 24.9 49.5 13.0 39.1 (45.6) 80.8
Average
2011 .............................. 16.8 54.2 8.0 57.3 (34.4) 101.8
2010 .............................. 27.2 51.6 9.2 62.0 (36.5) 113.4
Minimum
2011 .............................. 7.6 30.1 2.5 34.7 – 62.2
2010 .............................. 8.0 34.7 2.9 33.7 – 55.0
Maximum
2011 .............................. 31.9 80.2 17.2 103.2 – 143.9
2010 .............................. 62.9 88.9 21.6 102.5 – 212.2
For footnotes, see page 185.
The VAR for trading intent activity within Global
Markets at 31 December 2011 was US$118.3m
(2010: US$80.8m). The increase was mainly driven
by the credit spread asset class, due to a rise in the
volatilities in the historical scenarios used in the
VAR calculation.
Credit spread risk
(Audited)
Credit spread risk also arises on credit derivative
transactions entered into by Global Banking in
order to manage the risk concentrations within our
corporate loan portfolio and so enhance capital
efficiency. At 31 December 2011, the credit VAR
on these transactions was US$6.6m (2010:
US$12.3m). The mark-to-market of these
transactions is reflected in the income statement.
Gap risk
During 2011 gap risk continued to be managed
down. We did not incur any material gap loss in
2011.
Non-trading portfolios
(Audited)
Available-for-sale debt securities
At 31 December 2011, the sensitivity of equity
capital to the effect of movements in credit spreads
on our available-for-sale debt securities, including
the gross exposure for the SICs consolidated within
our balance sheet, based on credit spread VAR, was
US$389m (2010: US$299m). This sensitivity is
calculated before taking into account losses which
would have been absorbed by the capital note
holders. Excluding the gross exposure for SICs
consolidated in our balance sheet this exposure
reduced to US$325m (2010: US$264m). (Credit
spread VAR for available-for-sale debt securities
is included in the Group total VAR.)
At 31 December 2011, the capital note holders
would absorb the first US$2.3bn (2010: US$2.2bn)
of any losses incurred by the SICs before we incur
any equity losses.
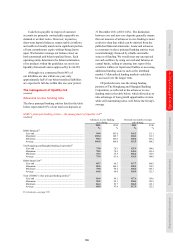
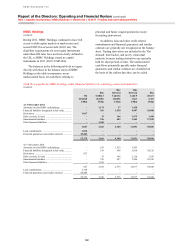
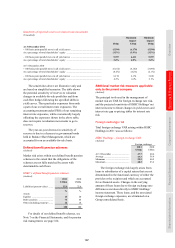
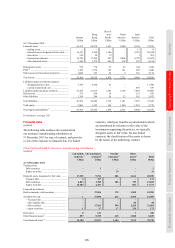
Equity securities classified as available for sale
Fair value of equity securities
(Audited)
2011 2010
US$bn US$bn
Private equity holdings63 ............. 3.0 2.8
Funds invested for short-term
cash management ................... 0.2 0.5
Investment to facilitate
ongoing business64 .................. 1.1 1.0
Other strategic investments ........ 2.9 3.7
7.2 8.0
For footnotes, see page 185.
Potential new commitments are subject to risk
appraisal to ensure that industry and geographical
concentrations remain within acceptable levels for
the portfolio. Regular reviews are performed to
substantiate the valuation of the investments within
the portfolio and investments held to facilitate
ongoing business, such as holdings in government-
sponsored enterprises and local stock exchanges.
The fair value of the constituents of equity
securities classified as available for sale can
fluctuate considerably. A 10% reduction in their
value at 31 December 2011 would have reduced our
equity by US$0.7bn (2010: US$0.8bn). For details of
the impairment incurred on available-for-sale equity