HSBC 2011 Annual Report Download - page 157
Download and view the complete annual report
Please find page 157 of the 2011 HSBC annual report below. You can navigate through the pages in the report by either clicking on the pages listed below, or by using the keyword search tool below to find specific information within the annual report.-
 1
1 -
2
-
3
-
4
-
5
-
6
-
7
-
8
-
9
-
10
-
11
-
12
-
13
-
14
-
15
-
16
-
17
-
18
-
19
-
20
-
21
-
22
-
23
-
24
-
25
-
26
-
27
-
28
-
29
-
30
-
31
-
32
-
33
-
34
-
35
-
36
-
37
-
38
-
39
-
40
-
41
-
42
-
43
-
44
-
45
-
46
-
47
-
48
-
49
-
50
-
51
-
52
-
53
-
54
-
55
-
56
-
57
-
58
-
59
-
60
-
61
-
62
-
63
-
64
-
65
-
66
-
67
-
68
-
69
-
70
-
71
-
72
-
73
-
74
-
75
-
76
-
77
-
78
-
79
-
80
-
81
-
82
-
83
-
84
-
85
-
86
-
87
-
88
-
89
-
90
-
91
-
92
-
93
-
94
-
95
-
96
-
97
-
98
-
99
-
100
-
101
-
102
-
103
-
104
-
105
-
106
-
107
-
108
-
109
-
110
-
111
-
112
-
113
-
114
-
115
-
116
-
117
-
118
-
119
-
120
-
121
-
122
-
123
-
124
-
125
-
126
-
127
-
128
-
129
-
130
-
131
-
132
-
133
-
134
-
135
-
136
-
137
-
138
-
139
-
140
-
141
-
142
-
143
-
144
-
145
-
146
-
 147
147 -
 148
148 -
 149
149 -
 150
150 -
 151
151 -
 152
152 -
 153
153 -
 154
154 -
 155
155 -
 156
156 -
 157
157 -
 158
158 -
 159
159 -
 160
160 -
 161
161 -
 162
162 -
 163
163 -
 164
164 -
 165
165 -
 166
166 -
 167
167 -
168
-
169
-
170
-
171
-
172
-
173
-
174
-
175
-
176
-
177
-
178
-
179
-
180
-
181
-
182
-
183
-
184
-
185
-
186
-
187
-
188
-
189
-
190
-
191
-
192
-
193
-
194
-
195
-
196
-
197
-
198
-
199
-
200
-
201
-
202
-
203
-
204
-
205
-
206
-
207
-
208
-
209
-
210
-
211
-
212
-
213
-
214
-
215
-
216
-
217
-
218
-
219
-
220
-
221
-
222
-
223
-
224
-
225
-
226
-
227
-
228
-
229
-
230
-
231
-
232
-
233
-
234
-
235
-
236
-
237
-
238
-
239
-
240
-
241
-
242
-
243
-
244
-
245
-
246
-
247
-
248
-
249
-
250
-
251
-
252
-
253
-
254
-
255
-
256
-
257
-
258
-
259
-
260
-
261
-
262
-
263
-
264
-
265
-
266
-
267
-
268
-
269
-
270
-
271
-
272
-
273
-
274
-
275
-
276
-
277
-
278
-
279
-
280
-
281
-
282
-
283
-
284
-
285
-
286
-
287
-
288
-
289
-
290
-
291
-
292
-
293
-
294
-
295
-
296
-
297
-
298
-
299
-
300
-
301
-
302
-
303
-
304
-
305
-
306
-
307
-
308
-
309
-
310
-
311
-
312
-
313
-
314
-
315
-
316
-
317
-
318
-
319
-
320
-
321
-
322
-
323
-
324
-
325
-
326
-
327
-
328
-
329
-
330
-
331
-
332
-
333
-
334
-
335
-
336
-
337
-
338
-
339
-
340
-
341
-
342
-
343
-
344
-
345
-
346
-
347
-
348
-
349
-
350
-
351
-
352
-
353
-
354
-
355
-
356
-
357
-
358
-
359
-
360
-
361
-
362
-
363
-
364
-
365
-
366
-
367
-
368
-
369
-
370
-
371
-
372
-
373
-
374
-
375
-
376
-
377
-
378
-
379
-
380
-
381
-
382
-
383
-
384
-
385
-
386
-
387
-
388
-
389
-
390
-
391
-
392
-
393
-
394
-
395
-
396
-
397
-
398
-
399
-
400
-
401
-
402
-
403
-
404
-
405
-
406
-
407
-
408
-
409
-
410
-
411
-
412
-
413
-
414
-
415
-
416
-
417
-
418
-
419
-
420
-
421
-
422
-
423
-
424
-
425
-
426
-
427
-
428
-
429
-
430
-
431
-
432
-
433
-
434
-
435
-
436
-
437
-
438
-
439
-
440
 |
 |

155
Overview Operating & Financial Review Corporate Governance Financial Statements Shareholder Information
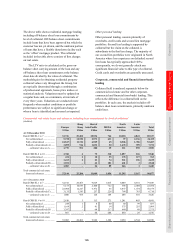
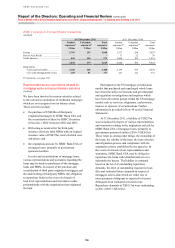
Market prices are generally not readily available
for CDSs, so they are valued on the basis of market
prices of the referenced securities.
Our monoline credit valuation adjustment
calculation utilises a number of approaches which
depend upon the internal credit rating of the
monoline. Our assignment of internal credit ratings
is based upon detailed credit analysis, and may differ
from external ratings. The net effect of utilising the
methodology adopted for ‘highly-rated’ monolines
across all monolines would be a reduction in credit
valuation adjustment of US$76m (2010: US$94m).
The net effect of utilising a methodology based on
CDS spreads would be an increase in credit
valuation adjustment of US$178m (2010: US$8m).
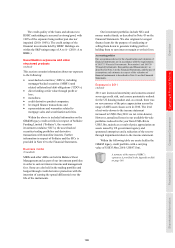
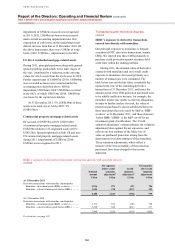
Credit valuation adjustments for monolines
• For highly-rated monolines, the standard credit valuation
adjustment methodology (as described on page 350) applies,
with the exception that the future exposure profile is
deemed to be constant (equal to the current market value)
over the weighted average life of the referenced security,
and the credit valuation adjustment cannot fall below 10%
of the mark-to-market exposure.
• In respect of monolines where default has either occurred
or there is a strong possibility of default in the near term,
the adjustment is determined based on the estimated
probabilities of various potential scenarios, and the
estimated recovery in each case.
• For other monoline exposures, the credit valuation
adjustment follows the methodology for highly-rated
monolines, adjusted to include the probability of a claim
arising in respect of the referenced security, and applies
implied probabilities of default where the likelihood of a
claim is believed to be high.
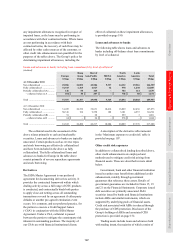
HSBC’s exposure to direct lending and
irrevocable commitments to lend to monoline
insurers
We had no liquidity facilities to monolines at
31 December 2011 (2010: nil).
HSBC’s exposure to debt securities which benefit
from guarantees provided by monolines
Within both the trading and available-for-sale
portfolios, we hold bonds that are ‘wrapped’ with
a credit enhancement from a monoline. As the
bonds are traded explicitly with the benefit of this
enhancement, any deterioration in the credit profile
of the monoline is reflected in market prices and,
therefore, in the carrying amount of these securities
at 31 December 2011. For wrapped bonds held in
our trading portfolio, the mark-to-market movement
is reflected through the income statement. For
wrapped bonds held in the AFS portfolio, the mark-
to-market movement is reflected in equity unless
there is objective evidence of impairment, in which
case the impairment loss is reflected in the income
statement. No wrapped bonds were included in the
reclassification of financial assets described in
Note 18 on the Financial Statements.
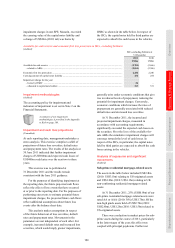
HSBC’s exposure to credit derivative product
companies
Credit derivative product companies (‘CDPC’s) are
independent companies that specialise in selling
credit default protection on corporate exposures. At
31 December 2011, we had purchased from CDPCs
credit protection with a notional value of US$4.4bn
(2010: US$4.9bn) which had a fair value of
US$0.4bn (2010: US$0.2bn), against which a credit
valuation adjustment (a provision) of US$0.1bn was
held (2010: US$0.1bn). At 31 December 2011, none
of our exposure was to CDPCs with investment
grade ratings (2010: nil).
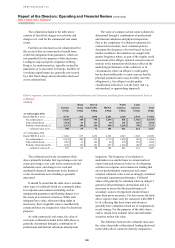
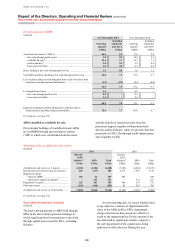
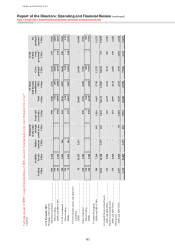
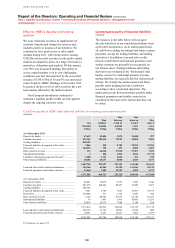
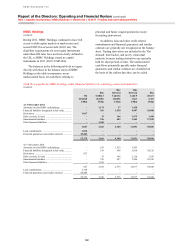
Leveraged finance transactions
(Audited)
Leveraged finance transactions include sub-
investment grade acquisition or event-driven
financing. The following table shows our exposure
to leveraged finance transactions arising from
primary transactions. Our additional exposure to
leveraged finance loans through holdings of ABSs
from our trading and investment activities is shown
in the table on page 152.
We held leveraged finance commitments of
US$3.7bn at 31 December 2011 (2010: US$5.1bn),
of which US$3.3bn (2010: US$4.6bn) was funded.
At 31 December 2011, our principal exposures
were to companies in two sectors: US$1.3bn to
data processing (2010: US$2.8bn) and US$1.9bn
to communications and infrastructure (2010:
US$1.8bn).