HSBC 2011 Annual Report Download - page 337
Download and view the complete annual report
Please find page 337 of the 2011 HSBC annual report below. You can navigate through the pages in the report by either clicking on the pages listed below, or by using the keyword search tool below to find specific information within the annual report.-
 1
1 -
2
-
3
-
4
-
5
-
6
-
7
-
8
-
9
-
10
-
11
-
12
-
13
-
14
-
15
-
16
-
17
-
18
-
19
-
20
-
21
-
22
-
23
-
24
-
25
-
26
-
27
-
28
-
29
-
30
-
31
-
32
-
33
-
34
-
35
-
36
-
37
-
38
-
39
-
40
-
41
-
42
-
43
-
44
-
45
-
46
-
47
-
48
-
49
-
50
-
51
-
52
-
53
-
54
-
55
-
56
-
57
-
58
-
59
-
60
-
61
-
62
-
63
-
64
-
65
-
66
-
67
-
68
-
69
-
70
-
71
-
72
-
73
-
74
-
75
-
76
-
77
-
78
-
79
-
80
-
81
-
82
-
83
-
84
-
85
-
86
-
87
-
88
-
89
-
90
-
91
-
92
-
93
-
94
-
95
-
96
-
97
-
98
-
99
-
100
-
101
-
102
-
103
-
104
-
105
-
106
-
107
-
108
-
109
-
110
-
111
-
112
-
113
-
114
-
115
-
116
-
117
-
118
-
119
-
120
-
121
-
122
-
123
-
124
-
125
-
126
-
127
-
128
-
129
-
130
-
131
-
132
-
133
-
134
-
135
-
136
-
137
-
138
-
139
-
140
-
141
-
142
-
143
-
144
-
145
-
146
-
147
-
148
-
149
-
150
-
151
-
152
-
153
-
154
-
155
-
156
-
157
-
158
-
159
-
160
-
161
-
162
-
163
-
164
-
165
-
166
-
167
-
168
-
169
-
170
-
171
-
172
-
173
-
174
-
175
-
176
-
177
-
178
-
179
-
180
-
181
-
182
-
183
-
184
-
185
-
186
-
187
-
188
-
189
-
190
-
191
-
192
-
193
-
194
-
195
-
196
-
197
-
198
-
199
-
200
-
201
-
202
-
203
-
204
-
205
-
206
-
207
-
208
-
209
-
210
-
211
-
212
-
213
-
214
-
215
-
216
-
217
-
218
-
219
-
220
-
221
-
222
-
223
-
224
-
225
-
226
-
227
-
228
-
229
-
230
-
231
-
232
-
233
-
234
-
235
-
236
-
237
-
238
-
239
-
240
-
241
-
242
-
243
-
244
-
245
-
246
-
247
-
248
-
249
-
250
-
251
-
252
-
253
-
254
-
255
-
256
-
257
-
258
-
259
-
260
-
261
-
262
-
263
-
264
-
265
-
266
-
267
-
268
-
269
-
270
-
271
-
272
-
273
-
274
-
275
-
276
-
277
-
278
-
279
-
280
-
281
-
282
-
283
-
284
-
285
-
286
-
287
-
288
-
289
-
290
-
291
-
292
-
293
-
294
-
295
-
296
-
297
-
298
-
299
-
300
-
301
-
302
-
303
-
304
-
305
-
306
-
307
-
308
-
309
-
310
-
311
-
312
-
313
-
314
-
315
-
316
-
317
-
318
-
319
-
320
-
321
-
322
-
323
-
324
-
325
-
326
-
 327
327 -
 328
328 -
 329
329 -
 330
330 -
 331
331 -
 332
332 -
 333
333 -
 334
334 -
 335
335 -
 336
336 -
 337
337 -
 338
338 -
 339
339 -
 340
340 -
 341
341 -
 342
342 -
 343
343 -
 344
344 -
 345
345 -
 346
346 -
 347
347 -
348
-
349
-
350
-
351
-
352
-
353
-
354
-
355
-
356
-
357
-
358
-
359
-
360
-
361
-
362
-
363
-
364
-
365
-
366
-
367
-
368
-
369
-
370
-
371
-
372
-
373
-
374
-
375
-
376
-
377
-
378
-
379
-
380
-
381
-
382
-
383
-
384
-
385
-
386
-
387
-
388
-
389
-
390
-
391
-
392
-
393
-
394
-
395
-
396
-
397
-
398
-
399
-
400
-
401
-
402
-
403
-
404
-
405
-
406
-
407
-
408
-
409
-
410
-
411
-
412
-
413
-
414
-
415
-
416
-
417
-
418
-
419
-
420
-
421
-
422
-
423
-
424
-
425
-
426
-
427
-
428
-
429
-
430
-
431
-
432
-
433
-
434
-
435
-
436
-
437
-
438
-
439
-
440
 |
 |

335
Overview Operating & Financial Review Corporate Governance Financial Statements Shareholder Information
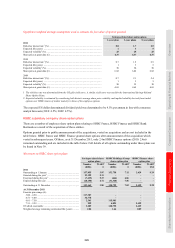
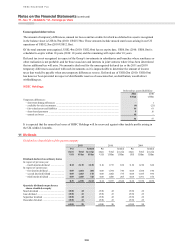
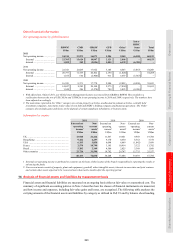
Quarterly coupons on capital securities classified as equity1
2011 2010 2009
Per share Total Per share Total Per share Total
US$ US$m US$ US$m US$ US$m
January coupon .................................. 0.508 44 0.508 44 0.508 44
March coupon .................................... 0.500 76 – – – –
April coupon ...................................... 0.508 45 0.508 45 0.508 45
June coupon ....................................... 0.500 76 – – – –
July coupon ........................................ 0.508 45 0.508 45 0.508 45
September coupon ............................. 0.500 76 0.450 68 – –
October coupon .................................. 0.508 45 0.508 45 0.508 45
December coupon .............................. 0.500 76 0.500 76 – –
4.032 483 2.982 323 2.032 179
1 HSBC Holdings issued Perpetual Subordinated Capital Securities of US$3,800m in June 2010 and US$2,200m in April 2008, which are
classified as equity under IFRSs.
The Directors declared after the end of the year a fourth interim dividend in respect of the financial year ended
31 December 2011 of US$0.14 per ordinary share, a distribution of approximately US$2,515m. The fourth interim
dividend will be payable on 2 May 2012 to holders of record on 15 March 2012 on the Hong Kong Overseas Branch
Register and 16 March 2012 on the Principal Register in the UK or the Bermuda Overseas Branch Register. No
liability is recorded in the financial statements in respect of the fourth interim dividend for 2011.
On 17 January 2012, HSBC paid a further coupon on the capital securities of US$0.508 per security, a distribution of
US$44m. No liability is recorded in the balance sheet at 31 December 2011 in respect of this coupon payment.
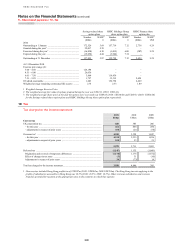
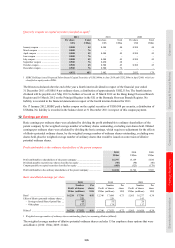
12 Earnings per share
Basic earnings per ordinary share was calculated by dividing the profit attributable to ordinary shareholders of the
parent company by the weighted average number of ordinary shares outstanding, excluding own shares held. Diluted
earnings per ordinary share was calculated by dividing the basic earnings, which require no adjustment for the effects
of dilutive potential ordinary shares, by the weighted average number of ordinary shares outstanding, excluding own
shares held, plus the weighted average number of ordinary shares that would be issued on conversion of dilutive
potential ordinary shares.
Profit attributable to the ordinary shareholders of the parent company
2011 2010 2009
US$m US$m US$m
Profit attributable to shareholders of the parent company ......................................... 16,797 13,159 5,834
Dividend payable on preference shares classified as equity ...................................... (90) (90) (90)
Coupon payable on capital securities classified as equity ......................................... (483) (323) (179)
Profit attributable to the ordinary shareholders of the parent company ..................... 16,224 12,746 5,565
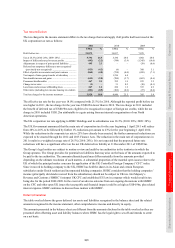
Basic and diluted earnings per share
2011 2010 2009
Profit
US$m
Number
of shares
(millions)
Per
share
US$
Profit
US$m
Number
of shares
(millions)
Per
share
US$
Profit
US$m
Number
of shares
(millions)
Per
share
US$
Basic1 .......................................................... 16,224 17,700 0.92 12,746 17,404 0.73 5,565 16,277 0.34
Effect of dilutive potential ordinary shares ... 222 229 143
– Savings-related Share Option Plan .... 45 55 26
– Other plans ......................................... 177 174 117
Diluted1 ....................................................... 16,224 17,922 0.91 12,746 17,633 0.72 5,565 16,420 0.34
1 Weighted average number of ordinary shares outstanding (basic) or assuming dilution (diluted).
The weighted average number of dilutive potential ordinary shares excludes 151m employee share options that were
anti-dilutive (2010: 150m; 2009: 214m).