HSBC 2011 Annual Report Download - page 132
Download and view the complete annual report
Please find page 132 of the 2011 HSBC annual report below. You can navigate through the pages in the report by either clicking on the pages listed below, or by using the keyword search tool below to find specific information within the annual report.-
 1
1 -
2
-
3
-
4
-
5
-
6
-
7
-
8
-
9
-
10
-
11
-
12
-
13
-
14
-
15
-
16
-
17
-
18
-
19
-
20
-
21
-
22
-
23
-
24
-
25
-
26
-
27
-
28
-
29
-
30
-
31
-
32
-
33
-
34
-
35
-
36
-
37
-
38
-
39
-
40
-
41
-
42
-
43
-
44
-
45
-
46
-
47
-
48
-
49
-
50
-
51
-
52
-
53
-
54
-
55
-
56
-
57
-
58
-
59
-
60
-
61
-
62
-
63
-
64
-
65
-
66
-
67
-
68
-
69
-
70
-
71
-
72
-
73
-
74
-
75
-
76
-
77
-
78
-
79
-
80
-
81
-
82
-
83
-
84
-
85
-
86
-
87
-
88
-
89
-
90
-
91
-
92
-
93
-
94
-
95
-
96
-
97
-
98
-
99
-
100
-
101
-
102
-
103
-
104
-
105
-
106
-
107
-
108
-
109
-
110
-
111
-
112
-
113
-
114
-
115
-
116
-
117
-
118
-
119
-
120
-
121
-
 122
122 -
 123
123 -
 124
124 -
 125
125 -
 126
126 -
 127
127 -
 128
128 -
 129
129 -
 130
130 -
 131
131 -
 132
132 -
 133
133 -
 134
134 -
 135
135 -
 136
136 -
 137
137 -
 138
138 -
 139
139 -
 140
140 -
 141
141 -
 142
142 -
143
-
144
-
145
-
146
-
147
-
148
-
149
-
150
-
151
-
152
-
153
-
154
-
155
-
156
-
157
-
158
-
159
-
160
-
161
-
162
-
163
-
164
-
165
-
166
-
167
-
168
-
169
-
170
-
171
-
172
-
173
-
174
-
175
-
176
-
177
-
178
-
179
-
180
-
181
-
182
-
183
-
184
-
185
-
186
-
187
-
188
-
189
-
190
-
191
-
192
-
193
-
194
-
195
-
196
-
197
-
198
-
199
-
200
-
201
-
202
-
203
-
204
-
205
-
206
-
207
-
208
-
209
-
210
-
211
-
212
-
213
-
214
-
215
-
216
-
217
-
218
-
219
-
220
-
221
-
222
-
223
-
224
-
225
-
226
-
227
-
228
-
229
-
230
-
231
-
232
-
233
-
234
-
235
-
236
-
237
-
238
-
239
-
240
-
241
-
242
-
243
-
244
-
245
-
246
-
247
-
248
-
249
-
250
-
251
-
252
-
253
-
254
-
255
-
256
-
257
-
258
-
259
-
260
-
261
-
262
-
263
-
264
-
265
-
266
-
267
-
268
-
269
-
270
-
271
-
272
-
273
-
274
-
275
-
276
-
277
-
278
-
279
-
280
-
281
-
282
-
283
-
284
-
285
-
286
-
287
-
288
-
289
-
290
-
291
-
292
-
293
-
294
-
295
-
296
-
297
-
298
-
299
-
300
-
301
-
302
-
303
-
304
-
305
-
306
-
307
-
308
-
309
-
310
-
311
-
312
-
313
-
314
-
315
-
316
-
317
-
318
-
319
-
320
-
321
-
322
-
323
-
324
-
325
-
326
-
327
-
328
-
329
-
330
-
331
-
332
-
333
-
334
-
335
-
336
-
337
-
338
-
339
-
340
-
341
-
342
-
343
-
344
-
345
-
346
-
347
-
348
-
349
-
350
-
351
-
352
-
353
-
354
-
355
-
356
-
357
-
358
-
359
-
360
-
361
-
362
-
363
-
364
-
365
-
366
-
367
-
368
-
369
-
370
-
371
-
372
-
373
-
374
-
375
-
376
-
377
-
378
-
379
-
380
-
381
-
382
-
383
-
384
-
385
-
386
-
387
-
388
-
389
-
390
-
391
-
392
-
393
-
394
-
395
-
396
-
397
-
398
-
399
-
400
-
401
-
402
-
403
-
404
-
405
-
406
-
407
-
408
-
409
-
410
-
411
-
412
-
413
-
414
-
415
-
416
-
417
-
418
-
419
-
420
-
421
-
422
-
423
-
424
-
425
-
426
-
427
-
428
-
429
-
430
-
431
-
432
-
433
-
434
-
435
-
436
-
437
-
438
-
439
-
440
 |
 |

HSBC HOLDINGS PLC
Report of the Directors: Operating and Financial Review (continued)
Risk > Credit risk > Credit quality > Renegotiated loans and forbearance
130
more stringent impaired loan disclosure convention
for portfolios with significant levels of forbearance
as described on page 133.
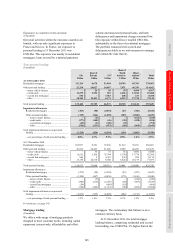
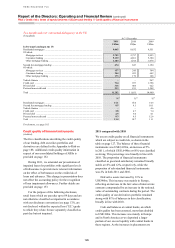
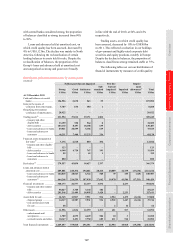
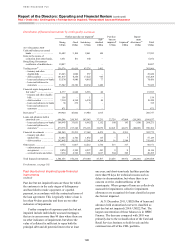
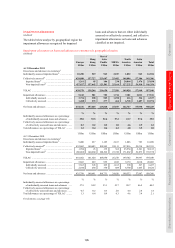
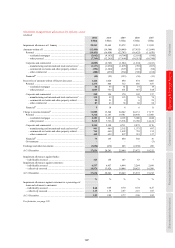
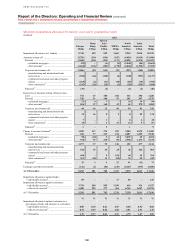
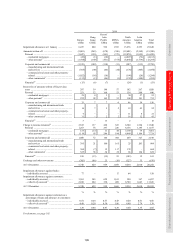
The following tables show the Group’s holdings
of renegotiated loans and advances to customers by
industry sector, geography and credit quality
classification.
Renegotiated loans and advances to customers
(Audited)
At 31 December 2011 At 31 December 2010
Neither
past
due nor
impaired
Past due
but not
impaired Impaired Total
Neither
past
due nor
impaired
Past due
but not
impaired Impaired Total
US$m US$m US$m US$m US$m US$m US$m US$m
Retail .......................................... 8,133 4,401 19,125 31,659 7,690 4,339 23,406 35,435
Residential Mortgages............ 5,916 3,560 15,932 25,408 5,244 3,381 18,137 26,762
Other personal ....................... 2,217 841 3,193 6,251 2,446 958 5,269 8,673
Commercial real estate ............... 2,793 9 3,248 6,050 2,877 12 2,401 5,290
Corporate and commercial ......... 3,432 461 3,376 7,269 4,125 186 2,501 6,812
Financial .................................... 249 – 491 740 17 – 565 582
Governments .............................. 113 2 132 247 51 – 7 58
14,720 4,873 26,372 45,965 14,760 4,537 28,880 48,177
Total renegotiated loans and advances to customers as a percentage
of total gross loans and advances to customers .................................... 4.8% 5.0%
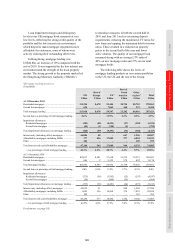
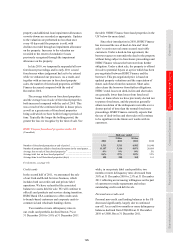
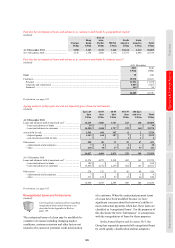
Renegotiated loans and advances to customers by geography
(Unaudited)
2011 2010
US$m US$m
Europe ........................................................................................................................................................................ 11,464 10,692
Hong Kong ................................................................................................................................................................ 447 420
Rest of Asia-Pacific ................................................................................................................................................... 448 679
Middle East and North Africa ................................................................................................................................... 2,655 1,866
North America ........................................................................................................................................................... 28,475 31,990
Latin America ............................................................................................................................................................ 2,476 2,530
Total ........................................................................................................................................................................... 45,965 48,177
Total impairment allowances on renegotiated loans ................................................................................................. 7,670 7,482
Individually assessed ............................................................................................................................................. 2,311 1,657
Collectively assessed ............................................................................................................................................. 5,359 5,825
2011 compared with 2010
(Unaudited)
Renegotiated loans totalled US$46.0bn at
31 December 2011 (2010: US$48.1bn). The most
significant volume of renegotiation activity took
place in North America and, at 31 December 2011,
amounted to US$28.5bn or 62% of total renegotiated
loans (2010: US$32.0bn or 66%), substantially all of
which were retail loans held by HSBC Finance. Of
the total renegotiated loans in North America,
US$17.8bn were presented as impaired at
31 December 2011 (2010: US$22.0bn), and the ratio
of total impairment allowances to impaired loans at
31 December 2011 was 28% (2010: 25%).
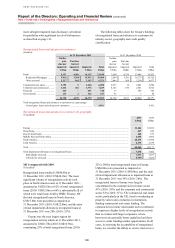
Europe was the next largest region for
renegotiation activity which, at 31 December 2011,
amounted to US$11.5bn (2010: US$10.7bn),
constituting 25% of total renegotiated loans (2010:
22%). Of the total renegotiated loans in Europe,
US$6.0bn were presented as impaired at
31 December 2011 (2010: US$4.8bn), and the ratio
of total impairment allowances to impaired loans at
31 December 2011 was 30% (2010: 28%). The
renegotiated loans in Europe were largely
concentrated in the commercial real estate sector
41% (2010: 39%) and the corporate and commercial
sector 32% (2010: 31%). The commercial real estate
sector, particularly in the UK, faced a weakening in
property values and a reduction in institutions
funding commercial real estate lending. The
commercial real estate mid-market sector continued
to experience higher levels of renegotiation activity
than is evident with larger corporates, where
borrowers are generally better capitalised and have
access to wider funding market opportunities. In all
cases, in assessing the acceptability of renegotiated
loans, we consider the ability to service interest as a