HSBC 2011 Annual Report Download - page 329
Download and view the complete annual report
Please find page 329 of the 2011 HSBC annual report below. You can navigate through the pages in the report by either clicking on the pages listed below, or by using the keyword search tool below to find specific information within the annual report.-
 1
1 -
2
-
3
-
4
-
5
-
6
-
7
-
8
-
9
-
10
-
11
-
12
-
13
-
14
-
15
-
16
-
17
-
18
-
19
-
20
-
21
-
22
-
23
-
24
-
25
-
26
-
27
-
28
-
29
-
30
-
31
-
32
-
33
-
34
-
35
-
36
-
37
-
38
-
39
-
40
-
41
-
42
-
43
-
44
-
45
-
46
-
47
-
48
-
49
-
50
-
51
-
52
-
53
-
54
-
55
-
56
-
57
-
58
-
59
-
60
-
61
-
62
-
63
-
64
-
65
-
66
-
67
-
68
-
69
-
70
-
71
-
72
-
73
-
74
-
75
-
76
-
77
-
78
-
79
-
80
-
81
-
82
-
83
-
84
-
85
-
86
-
87
-
88
-
89
-
90
-
91
-
92
-
93
-
94
-
95
-
96
-
97
-
98
-
99
-
100
-
101
-
102
-
103
-
104
-
105
-
106
-
107
-
108
-
109
-
110
-
111
-
112
-
113
-
114
-
115
-
116
-
117
-
118
-
119
-
120
-
121
-
122
-
123
-
124
-
125
-
126
-
127
-
128
-
129
-
130
-
131
-
132
-
133
-
134
-
135
-
136
-
137
-
138
-
139
-
140
-
141
-
142
-
143
-
144
-
145
-
146
-
147
-
148
-
149
-
150
-
151
-
152
-
153
-
154
-
155
-
156
-
157
-
158
-
159
-
160
-
161
-
162
-
163
-
164
-
165
-
166
-
167
-
168
-
169
-
170
-
171
-
172
-
173
-
174
-
175
-
176
-
177
-
178
-
179
-
180
-
181
-
182
-
183
-
184
-
185
-
186
-
187
-
188
-
189
-
190
-
191
-
192
-
193
-
194
-
195
-
196
-
197
-
198
-
199
-
200
-
201
-
202
-
203
-
204
-
205
-
206
-
207
-
208
-
209
-
210
-
211
-
212
-
213
-
214
-
215
-
216
-
217
-
218
-
219
-
220
-
221
-
222
-
223
-
224
-
225
-
226
-
227
-
228
-
229
-
230
-
231
-
232
-
233
-
234
-
235
-
236
-
237
-
238
-
239
-
240
-
241
-
242
-
243
-
244
-
245
-
246
-
247
-
248
-
249
-
250
-
251
-
252
-
253
-
254
-
255
-
256
-
257
-
258
-
259
-
260
-
261
-
262
-
263
-
264
-
265
-
266
-
267
-
268
-
269
-
270
-
271
-
272
-
273
-
274
-
275
-
276
-
277
-
278
-
279
-
280
-
281
-
282
-
283
-
284
-
285
-
286
-
287
-
288
-
289
-
290
-
291
-
292
-
293
-
294
-
295
-
296
-
297
-
298
-
299
-
300
-
301
-
302
-
303
-
304
-
305
-
306
-
307
-
308
-
309
-
310
-
311
-
312
-
313
-
314
-
315
-
316
-
317
-
318
-
 319
319 -
 320
320 -
 321
321 -
 322
322 -
 323
323 -
 324
324 -
 325
325 -
 326
326 -
 327
327 -
 328
328 -
 329
329 -
 330
330 -
 331
331 -
 332
332 -
 333
333 -
 334
334 -
 335
335 -
 336
336 -
 337
337 -
 338
338 -
 339
339 -
340
-
341
-
342
-
343
-
344
-
345
-
346
-
347
-
348
-
349
-
350
-
351
-
352
-
353
-
354
-
355
-
356
-
357
-
358
-
359
-
360
-
361
-
362
-
363
-
364
-
365
-
366
-
367
-
368
-
369
-
370
-
371
-
372
-
373
-
374
-
375
-
376
-
377
-
378
-
379
-
380
-
381
-
382
-
383
-
384
-
385
-
386
-
387
-
388
-
389
-
390
-
391
-
392
-
393
-
394
-
395
-
396
-
397
-
398
-
399
-
400
-
401
-
402
-
403
-
404
-
405
-
406
-
407
-
408
-
409
-
410
-
411
-
412
-
413
-
414
-
415
-
416
-
417
-
418
-
419
-
420
-
421
-
422
-
423
-
424
-
425
-
426
-
427
-
428
-
429
-
430
-
431
-
432
-
433
-
434
-
435
-
436
-
437
-
438
-
439
-
440
 |
 |

327
Overview Operating & Financial Review Corporate Governance Financial Statements Shareholder Information
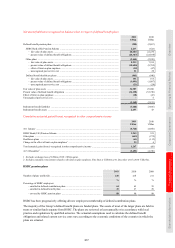
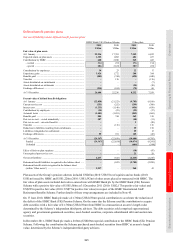
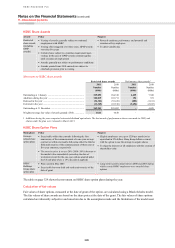
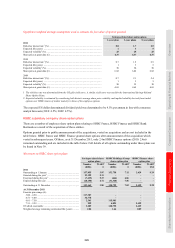
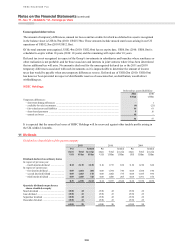
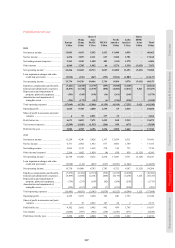
9 Share-based payments
Income statement charge
2011 2010 2009
US$m US$m US$m
Restricted and performance share awards1 ................................................................. 1,041 685 539
Savings-related and other share option plans ............................................................. 121 127 144
1,162 812 683
Equity-settled share-based payments .......................................................................... 1,154 812 683
Cash-settled share-based payments ............................................................................ 8 – –
1 Restricted share awards include awards granted under the Group Performance Share Plan (‘GPSP’), which was approved by
shareholders in May 2011.
The share-based payment income statement charge above includes US$974m (2010: US$610m; 2009: US$539m)
relating to deferred share awards (see below). These charges are recognised in ‘Wages and salaries’ (see Note 7).
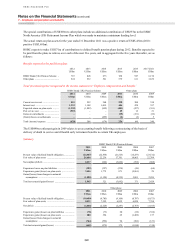
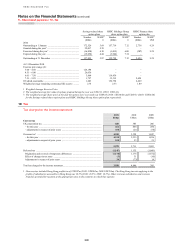
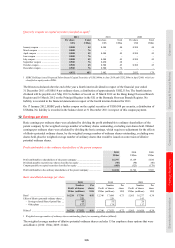
Deferred share awards
These awards are generally granted to employees early in the year following the year to which the award relates. The
charge for these awards is recognised from the start of the period to which the service relates to the end of the vesting
period. The vesting period is the period over which the employee satisfies certain service conditions in order to
become entitled to the award. Due to the staggered vesting profile of certain deferred share awards, the employee
becomes entitled to a portion of the award at the end of each year during the vesting period. The income statement
charge reflects this vesting profile. The following table identifies the charge recognised in the current year, or
expected to be recognised in future years, and the performance year to which the deferred share awards relate.
Income statement impact of deferred share awards on current and future years
Charge recognised in 2011
in respect of performance year:
Charge expected to be recognised in 2012
or later in respect of performance year:
20111 Pre-2011 Total 20111 Pre-2011 Total
US$m US$m US$m US$m US$m US$m
HSBC deferred share awards ............... 131 843 974 289 652 941
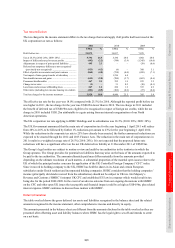
Charge recognised in 2010
in respect of performance year:
Charge expected to be recognised in 2011
or later in respect of performance year:
20101 Pre-2010 Total 20101 Pre-2010 Total
US$m US$m US$m US$m US$m US$m
HSBC deferred share awards ............... – 610 610 759 801 1,560
Charge recognised in 2009
in respect of performance year:
Charge expected to be recognised in 2010
or later in respect of performance year:
20091 Pre-2009 Total 20091 Pre-2009 Total
US$m US$m US$m US$m US$m US$m
HSBC deferred share awards ............... – 539 539 816 719 1,535
1 Regulatory and best practice guidance has clarified the required structure and terms of deferred bonus arrangements awarded to
employees, who now have a better understanding of the nature of the awards they may be granted. As a result, the vesting period for
deferred share awards expected to be granted in 2012 in respect of the 2011 performance year was determined to have started on
1 January 2011 and a charge was recognised from that date. Previously, the charge was recognised from the grant date.