HSBC 2011 Annual Report Download - page 177
Download and view the complete annual report
Please find page 177 of the 2011 HSBC annual report below. You can navigate through the pages in the report by either clicking on the pages listed below, or by using the keyword search tool below to find specific information within the annual report.-
 1
1 -
2
-
3
-
4
-
5
-
6
-
7
-
8
-
9
-
10
-
11
-
12
-
13
-
14
-
15
-
16
-
17
-
18
-
19
-
20
-
21
-
22
-
23
-
24
-
25
-
26
-
27
-
28
-
29
-
30
-
31
-
32
-
33
-
34
-
35
-
36
-
37
-
38
-
39
-
40
-
41
-
42
-
43
-
44
-
45
-
46
-
47
-
48
-
49
-
50
-
51
-
52
-
53
-
54
-
55
-
56
-
57
-
58
-
59
-
60
-
61
-
62
-
63
-
64
-
65
-
66
-
67
-
68
-
69
-
70
-
71
-
72
-
73
-
74
-
75
-
76
-
77
-
78
-
79
-
80
-
81
-
82
-
83
-
84
-
85
-
86
-
87
-
88
-
89
-
90
-
91
-
92
-
93
-
94
-
95
-
96
-
97
-
98
-
99
-
100
-
101
-
102
-
103
-
104
-
105
-
106
-
107
-
108
-
109
-
110
-
111
-
112
-
113
-
114
-
115
-
116
-
117
-
118
-
119
-
120
-
121
-
122
-
123
-
124
-
125
-
126
-
127
-
128
-
129
-
130
-
131
-
132
-
133
-
134
-
135
-
136
-
137
-
138
-
139
-
140
-
141
-
142
-
143
-
144
-
145
-
146
-
147
-
148
-
149
-
150
-
151
-
152
-
153
-
154
-
155
-
156
-
157
-
158
-
159
-
160
-
161
-
162
-
163
-
164
-
165
-
166
-
 167
167 -
 168
168 -
 169
169 -
 170
170 -
 171
171 -
 172
172 -
 173
173 -
 174
174 -
 175
175 -
 176
176 -
 177
177 -
 178
178 -
 179
179 -
 180
180 -
 181
181 -
 182
182 -
 183
183 -
 184
184 -
 185
185 -
 186
186 -
 187
187 -
188
-
189
-
190
-
191
-
192
-
193
-
194
-
195
-
196
-
197
-
198
-
199
-
200
-
201
-
202
-
203
-
204
-
205
-
206
-
207
-
208
-
209
-
210
-
211
-
212
-
213
-
214
-
215
-
216
-
217
-
218
-
219
-
220
-
221
-
222
-
223
-
224
-
225
-
226
-
227
-
228
-
229
-
230
-
231
-
232
-
233
-
234
-
235
-
236
-
237
-
238
-
239
-
240
-
241
-
242
-
243
-
244
-
245
-
246
-
247
-
248
-
249
-
250
-
251
-
252
-
253
-
254
-
255
-
256
-
257
-
258
-
259
-
260
-
261
-
262
-
263
-
264
-
265
-
266
-
267
-
268
-
269
-
270
-
271
-
272
-
273
-
274
-
275
-
276
-
277
-
278
-
279
-
280
-
281
-
282
-
283
-
284
-
285
-
286
-
287
-
288
-
289
-
290
-
291
-
292
-
293
-
294
-
295
-
296
-
297
-
298
-
299
-
300
-
301
-
302
-
303
-
304
-
305
-
306
-
307
-
308
-
309
-
310
-
311
-
312
-
313
-
314
-
315
-
316
-
317
-
318
-
319
-
320
-
321
-
322
-
323
-
324
-
325
-
326
-
327
-
328
-
329
-
330
-
331
-
332
-
333
-
334
-
335
-
336
-
337
-
338
-
339
-
340
-
341
-
342
-
343
-
344
-
345
-
346
-
347
-
348
-
349
-
350
-
351
-
352
-
353
-
354
-
355
-
356
-
357
-
358
-
359
-
360
-
361
-
362
-
363
-
364
-
365
-
366
-
367
-
368
-
369
-
370
-
371
-
372
-
373
-
374
-
375
-
376
-
377
-
378
-
379
-
380
-
381
-
382
-
383
-
384
-
385
-
386
-
387
-
388
-
389
-
390
-
391
-
392
-
393
-
394
-
395
-
396
-
397
-
398
-
399
-
400
-
401
-
402
-
403
-
404
-
405
-
406
-
407
-
408
-
409
-
410
-
411
-
412
-
413
-
414
-
415
-
416
-
417
-
418
-
419
-
420
-
421
-
422
-
423
-
424
-
425
-
426
-
427
-
428
-
429
-
430
-
431
-
432
-
433
-
434
-
435
-
436
-
437
-
438
-
439
-
440
 |
 |

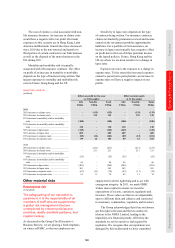
175
Overview Operating & Financial Review Corporate Governance Financial Statements Shareholder Information
Europe
Hong
Kong
Rest of
Asia-
Pacific
North
America
Latin
America
Total
US$m US$m US$m US$m US$m US$m
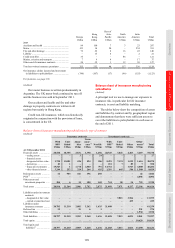
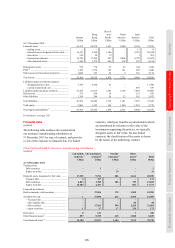
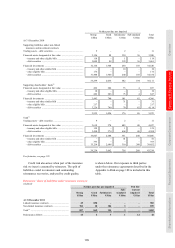
At 31 December 2010
Financial assets ................................................... 36,233 26,278 1,651 2,548 9,168 75,878
– trading assets ............................................... – – – – 11 11
– financial assets designated at fair value ...... 16,133 5,550 1,106 – 5,555 28,344
– derivatives ................................................... 238 50 12 – 1 301
– financial investments ................................... 16,758 17,299 247 2,006 2,722 39,032
– other financial assets ................................... 3,104 3,379 286 542 879 8,190
Reinsurance assets .............................................. 974 770 33 23 144 1,944
PVIF72 ................................................................. 1,102 1,734 165 141 298 3,440
Other assets and investment properties .............. 1,060 743 26 9 336 2,174
Total assets ......................................................... 39,369 29,525 1,875 2,721 9,946 83,436
Liabilities under investment contracts:
– designated at fair value ................................ 7,359 4,300 41 – – 11,700
– carried at amortised cost .............................. – – – – 439 439
Liabilities under insurance contracts .................. 27,475 21,515 1,381 1,169 7,069 58,609
Deferred tax ........................................................ 375 298 39 – 123 835
Other liabilities ................................................... 1,354 289 58 12 362 2,075
Total liabilities .................................................... 36,563 26,402 1,519 1,181 7,993 73,658
Total equity ......................................................... 2,806 3,123 356 1,540 1,953 9,778
Total equity and liabilities73 ............................... 39,369 29,525 1,875 2,721 9,946 83,436
For footnotes, see page 185.
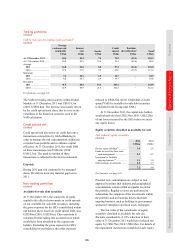
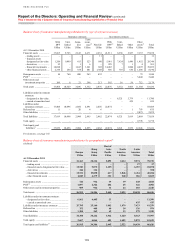
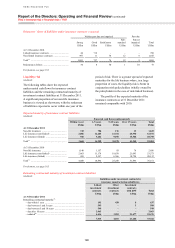
Financial risks
(Audited)
The following table analyses the assets held in
our insurance manufacturing subsidiaries at
31 December 2011 by type of contract, and provides
a view of the exposure to financial risk. For linked
contracts, which pay benefits to policyholders which
are determined by reference to the value of the
investments supporting the policies, we typically
designate assets at fair value; for non-linked
contracts, the classification of the assets is driven
by the nature of the underlying contract.
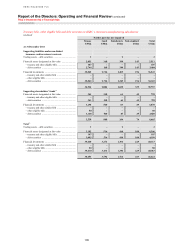
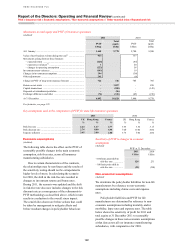
Financial assets held by insurance manufacturing subsidiaries
(Audited)
Life linked Life non-linked Non-life Other
contracts74 contracts75 insurance76 assets71 Total
US$m US$m US$m US$m US$m
At 31 December 2011
Trading assets
Debt securities ............................................ – 3 – – 3
Equity securities ......................................... – – 24 – 24
Financial assets designated at fair value ........ 17,292 9,756 206 1,616 28,870
Treasury bills .............................................. 4 107 – – 111
Debt securities ............................................ 6,823 3,198 206 795 11,022
Equity securities ......................................... 10,465 6,451 – 821 17,737
Financial investments
Held-to-maturity: debt securities..................... – 17,506 175 1,300 18,981
Available-for-sale: .......................................... 1 17,980 616 2,708 21,305
– Treasury bills ........................................... – – – – –
– other eligible bills .................................... – – – 50 50
– debt securities .......................................... – 17,963 599 2,520 21,082
– equity securities ....................................... 1 17 17 138 173
Derivatives ...................................................... 8 343 – 7 358
Other financial assets77 ................................... 897 5,709 635 1,588 8,829
Total financial assets73 .................................... 18,198 51,297 1,656 7,219 78,370