HSBC 2011 Annual Report Download - page 31
Download and view the complete annual report
Please find page 31 of the 2011 HSBC annual report below. You can navigate through the pages in the report by either clicking on the pages listed below, or by using the keyword search tool below to find specific information within the annual report.-
 1
1 -
2
-
3
-
4
-
5
-
6
-
7
-
8
-
9
-
10
-
11
-
12
-
13
-
14
-
15
-
16
-
17
-
18
-
19
-
20
-
 21
21 -
 22
22 -
 23
23 -
 24
24 -
 25
25 -
 26
26 -
 27
27 -
 28
28 -
 29
29 -
 30
30 -
 31
31 -
 32
32 -
 33
33 -
 34
34 -
 35
35 -
 36
36 -
 37
37 -
 38
38 -
 39
39 -
 40
40 -
 41
41 -
42
-
43
-
44
-
45
-
46
-
47
-
48
-
49
-
50
-
51
-
52
-
53
-
54
-
55
-
56
-
57
-
58
-
59
-
60
-
61
-
62
-
63
-
64
-
65
-
66
-
67
-
68
-
69
-
70
-
71
-
72
-
73
-
74
-
75
-
76
-
77
-
78
-
79
-
80
-
81
-
82
-
83
-
84
-
85
-
86
-
87
-
88
-
89
-
90
-
91
-
92
-
93
-
94
-
95
-
96
-
97
-
98
-
99
-
100
-
101
-
102
-
103
-
104
-
105
-
106
-
107
-
108
-
109
-
110
-
111
-
112
-
113
-
114
-
115
-
116
-
117
-
118
-
119
-
120
-
121
-
122
-
123
-
124
-
125
-
126
-
127
-
128
-
129
-
130
-
131
-
132
-
133
-
134
-
135
-
136
-
137
-
138
-
139
-
140
-
141
-
142
-
143
-
144
-
145
-
146
-
147
-
148
-
149
-
150
-
151
-
152
-
153
-
154
-
155
-
156
-
157
-
158
-
159
-
160
-
161
-
162
-
163
-
164
-
165
-
166
-
167
-
168
-
169
-
170
-
171
-
172
-
173
-
174
-
175
-
176
-
177
-
178
-
179
-
180
-
181
-
182
-
183
-
184
-
185
-
186
-
187
-
188
-
189
-
190
-
191
-
192
-
193
-
194
-
195
-
196
-
197
-
198
-
199
-
200
-
201
-
202
-
203
-
204
-
205
-
206
-
207
-
208
-
209
-
210
-
211
-
212
-
213
-
214
-
215
-
216
-
217
-
218
-
219
-
220
-
221
-
222
-
223
-
224
-
225
-
226
-
227
-
228
-
229
-
230
-
231
-
232
-
233
-
234
-
235
-
236
-
237
-
238
-
239
-
240
-
241
-
242
-
243
-
244
-
245
-
246
-
247
-
248
-
249
-
250
-
251
-
252
-
253
-
254
-
255
-
256
-
257
-
258
-
259
-
260
-
261
-
262
-
263
-
264
-
265
-
266
-
267
-
268
-
269
-
270
-
271
-
272
-
273
-
274
-
275
-
276
-
277
-
278
-
279
-
280
-
281
-
282
-
283
-
284
-
285
-
286
-
287
-
288
-
289
-
290
-
291
-
292
-
293
-
294
-
295
-
296
-
297
-
298
-
299
-
300
-
301
-
302
-
303
-
304
-
305
-
306
-
307
-
308
-
309
-
310
-
311
-
312
-
313
-
314
-
315
-
316
-
317
-
318
-
319
-
320
-
321
-
322
-
323
-
324
-
325
-
326
-
327
-
328
-
329
-
330
-
331
-
332
-
333
-
334
-
335
-
336
-
337
-
338
-
339
-
340
-
341
-
342
-
343
-
344
-
345
-
346
-
347
-
348
-
349
-
350
-
351
-
352
-
353
-
354
-
355
-
356
-
357
-
358
-
359
-
360
-
361
-
362
-
363
-
364
-
365
-
366
-
367
-
368
-
369
-
370
-
371
-
372
-
373
-
374
-
375
-
376
-
377
-
378
-
379
-
380
-
381
-
382
-
383
-
384
-
385
-
386
-
387
-
388
-
389
-
390
-
391
-
392
-
393
-
394
-
395
-
396
-
397
-
398
-
399
-
400
-
401
-
402
-
403
-
404
-
405
-
406
-
407
-
408
-
409
-
410
-
411
-
412
-
413
-
414
-
415
-
416
-
417
-
418
-
419
-
420
-
421
-
422
-
423
-
424
-
425
-
426
-
427
-
428
-
429
-
430
-
431
-
432
-
433
-
434
-
435
-
436
-
437
-
438
-
439
-
440
 |
 |

29
Overview Operating & Financial Review Corporate Governance Financial Statements Shareholder Information
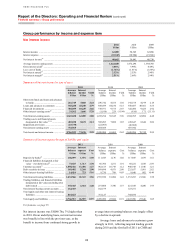
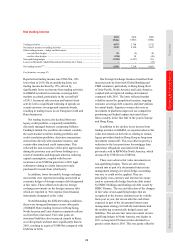
we continued to manage down unsecured lending,
together with impaired collections practices.
In Rest of Asia-Pacific, loan impairment charges
and other credit risk provisions declined by 42%
to US$267m, driven by reductions in India and
Singapore. The marked decline in India reflected
an improvement in delinquency, particularly in the
unsecured portfolios as lending balances were
managed down. In GB&M, loan impairment charges
and other credit risk provisions declined by 58%,
mainly in Singapore, due to a reduction in
individually assessed loan impairment charges.
In Latin America, loan impairment charges
increased by 17% to US$1.9bn. In Brazil, loan
impairment charges and other credit risk provisions
rose by 43% to US$1.4bn due to a rise in collective
loan impairment allowances in both RBWM and
CMB following the strong growth in our customer
lending balances and a rise in delinquency rates in
the second half of 2011. In addition, we recognised
a significant individually assessed loan impairment
charge related to a commercial customer. The
increase in Brazil was partly offset by a 28% decline
in loan impairment charges and other credit risk
provisions in Mexico. This was mainly in our
RBWM business due to lower balances in our credit
card portfolio as certain higher risk portfolios were
run-down and both credit quality and collections
improved.
In Hong Kong, loan impairment charges and
other credit risk provisions increased by 36% to
US$156m. In CMB, higher loan impairment charges
included a specific impairment charge related to a
single customer, as well as higher collectively
assessed charges reflecting growth in lending
balances. In GPB, loan impairment charges and other
credit risk provisions also increased, reflecting an
impairment of available-for-sale Greek sovereign
debt.
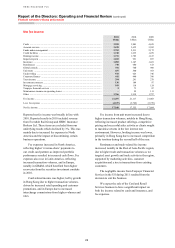
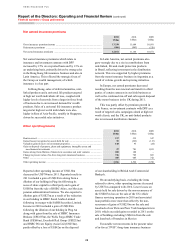
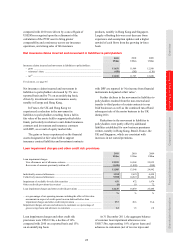
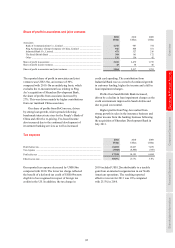
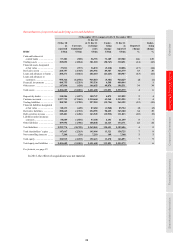
Operating expenses
2011 2010 2009
US$m US$m US$m
By expense category
Employee compensation and benefits ........................................................................ 21,166 19,836 18,468
Premises and equipment (excluding depreciation and impairment) .......................... 4,503 4,348 4,099
General and administrative expenses ......................................................................... 12,956 10,808 9,293
Administrative expenses ............................................................................................. 38,625 34,992 31,860
Depreciation and impairment of property, plant and equipment ............................... 1,570 1,713 1,725
Amortisation and impairment of intangible assets ..................................................... 1,350 983 810
Operating expenses ..................................................................................................... 41,545 37,688 34,395
Included in the above are the following notable cost items:
Restructuring costs (including impairment of assets)................................................. 1,122 154 301
UK customer redress programmes ............................................................................. 898 78 –
UK bank levy .............................................................................................................. 570 – –
Payroll tax ................................................................................................................... (13) 324 –
US mortgage foreclosure and servicing costs ............................................................. 257 – –
UK pension credit ....................................................................................................... (587) – (499)
US accounting gain on change in staff benefits ......................................................... – (148) –
Deferred variable compensation awards – accelerated amortisation ......................... 163 – –
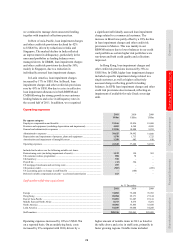
Staff numbers (full-time equivalents)
At 31 December
2011 2010 2009
Europe ......................................................................................................................... 74,892 75,698 76,703
Hong Kong ................................................................................................................. 28,984 29,171 27,614
Rest of Asia-Pacific .................................................................................................... 91,051 91,607 87,141
Middle East and North Africa .................................................................................... 8,373 8,676 8,281
North America ............................................................................................................ 30,981 33,865 35,458
Latin America ............................................................................................................. 54,035 56,044 54,288
Staff numbers .............................................................................................................. 288,316 295,061 289,485
Operating expenses increased by 10% to US$41.5bn
on a reported basis. On an underlying basis, costs
increased by 8% compared with 2010, driven by a
higher amount of notable items in 2011 as listed in
the table above and a rise in staff costs, primarily in
faster growing regions. Notable items included