HSBC 2011 Annual Report Download - page 361
Download and view the complete annual report
Please find page 361 of the 2011 HSBC annual report below. You can navigate through the pages in the report by either clicking on the pages listed below, or by using the keyword search tool below to find specific information within the annual report.-
 1
1 -
2
-
3
-
4
-
5
-
6
-
7
-
8
-
9
-
10
-
11
-
12
-
13
-
14
-
15
-
16
-
17
-
18
-
19
-
20
-
21
-
22
-
23
-
24
-
25
-
26
-
27
-
28
-
29
-
30
-
31
-
32
-
33
-
34
-
35
-
36
-
37
-
38
-
39
-
40
-
41
-
42
-
43
-
44
-
45
-
46
-
47
-
48
-
49
-
50
-
51
-
52
-
53
-
54
-
55
-
56
-
57
-
58
-
59
-
60
-
61
-
62
-
63
-
64
-
65
-
66
-
67
-
68
-
69
-
70
-
71
-
72
-
73
-
74
-
75
-
76
-
77
-
78
-
79
-
80
-
81
-
82
-
83
-
84
-
85
-
86
-
87
-
88
-
89
-
90
-
91
-
92
-
93
-
94
-
95
-
96
-
97
-
98
-
99
-
100
-
101
-
102
-
103
-
104
-
105
-
106
-
107
-
108
-
109
-
110
-
111
-
112
-
113
-
114
-
115
-
116
-
117
-
118
-
119
-
120
-
121
-
122
-
123
-
124
-
125
-
126
-
127
-
128
-
129
-
130
-
131
-
132
-
133
-
134
-
135
-
136
-
137
-
138
-
139
-
140
-
141
-
142
-
143
-
144
-
145
-
146
-
147
-
148
-
149
-
150
-
151
-
152
-
153
-
154
-
155
-
156
-
157
-
158
-
159
-
160
-
161
-
162
-
163
-
164
-
165
-
166
-
167
-
168
-
169
-
170
-
171
-
172
-
173
-
174
-
175
-
176
-
177
-
178
-
179
-
180
-
181
-
182
-
183
-
184
-
185
-
186
-
187
-
188
-
189
-
190
-
191
-
192
-
193
-
194
-
195
-
196
-
197
-
198
-
199
-
200
-
201
-
202
-
203
-
204
-
205
-
206
-
207
-
208
-
209
-
210
-
211
-
212
-
213
-
214
-
215
-
216
-
217
-
218
-
219
-
220
-
221
-
222
-
223
-
224
-
225
-
226
-
227
-
228
-
229
-
230
-
231
-
232
-
233
-
234
-
235
-
236
-
237
-
238
-
239
-
240
-
241
-
242
-
243
-
244
-
245
-
246
-
247
-
248
-
249
-
250
-
251
-
252
-
253
-
254
-
255
-
256
-
257
-
258
-
259
-
260
-
261
-
262
-
263
-
264
-
265
-
266
-
267
-
268
-
269
-
270
-
271
-
272
-
273
-
274
-
275
-
276
-
277
-
278
-
279
-
280
-
281
-
282
-
283
-
284
-
285
-
286
-
287
-
288
-
289
-
290
-
291
-
292
-
293
-
294
-
295
-
296
-
297
-
298
-
299
-
300
-
301
-
302
-
303
-
304
-
305
-
306
-
307
-
308
-
309
-
310
-
311
-
312
-
313
-
314
-
315
-
316
-
317
-
318
-
319
-
320
-
321
-
322
-
323
-
324
-
325
-
326
-
327
-
328
-
329
-
330
-
331
-
332
-
333
-
334
-
335
-
336
-
337
-
338
-
339
-
340
-
341
-
342
-
343
-
344
-
345
-
346
-
347
-
348
-
349
-
350
-
 351
351 -
 352
352 -
 353
353 -
 354
354 -
 355
355 -
 356
356 -
 357
357 -
 358
358 -
 359
359 -
 360
360 -
 361
361 -
 362
362 -
 363
363 -
 364
364 -
 365
365 -
 366
366 -
 367
367 -
 368
368 -
 369
369 -
 370
370 -
 371
371 -
372
-
373
-
374
-
375
-
376
-
377
-
378
-
379
-
380
-
381
-
382
-
383
-
384
-
385
-
386
-
387
-
388
-
389
-
390
-
391
-
392
-
393
-
394
-
395
-
396
-
397
-
398
-
399
-
400
-
401
-
402
-
403
-
404
-
405
-
406
-
407
-
408
-
409
-
410
-
411
-
412
-
413
-
414
-
415
-
416
-
417
-
418
-
419
-
420
-
421
-
422
-
423
-
424
-
425
-
426
-
427
-
428
-
429
-
430
-
431
-
432
-
433
-
434
-
435
-
436
-
437
-
438
-
439
-
440
 |
 |

359
Overview Operating & Financial Review Corporate Governance Financial Statements Shareholder Information
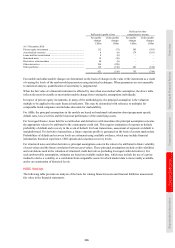
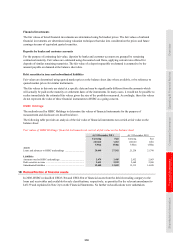
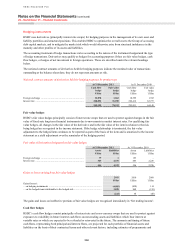
Financial investments
The fair values of listed financial investments are determined using bid market prices. The fair values of unlisted
financial investments are determined using valuation techniques that take into consideration the prices and future
earnings streams of equivalent quoted securities.
Deposits by banks and customer accounts
For the purpose of estimating fair value, deposits by banks and customer accounts are grouped by remaining
contractual maturity. Fair values are estimated using discounted cash flows, applying current rates offered for
deposits of similar remaining maturities. The fair value of a deposit repayable on demand is assumed to be the
amount payable on demand at the balance sheet date.
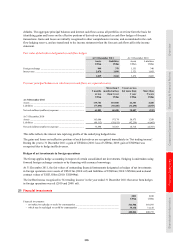
Debt securities in issue and subordinated liabilities
Fair values are determined using quoted market prices at the balance sheet date where available, or by reference to
quoted market prices for similar instruments.
The fair values in this note are stated at a specific date and may be significantly different from the amounts which
will actually be paid on the maturity or settlement dates of the instruments. In many cases, it would not be possible to
realise immediately the estimated fair values given the size of the portfolios measured. Accordingly, these fair values
do not represent the value of these financial instruments to HSBC as a going concern.
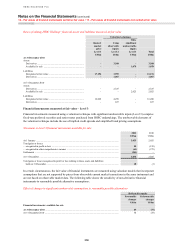
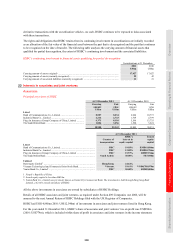
HSBC Holdings
The methods used by HSBC Holdings to determine fair values of financial instruments for the purpose of
measurement and disclosure are described above.
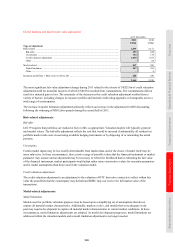
The following table provides an analysis of the fair value of financial instruments not carried at fair value on the
balance sheet:
Fair values of HSBC Holdings’ financial instruments not carried at fair value on the balance sheet
At 31 December 2011 At 31 December 2010
Carrying
amount
Fair
value
Carrying
amount
Fair
value
US$m US$m US$m US$m
Assets
Loans and advances to HSBC undertakings ................................ 28,048 27,562 21,238 21,798
Liabilities
Amounts owed to HSBC undertakings ........................................ 2,479 2,485 2,932 2,963
Debt securities in issue ................................................................. 2,613 2,922 2,668 2,960
Subordinated liabilities ................................................................. 12,450 13,052 13,313 14,428
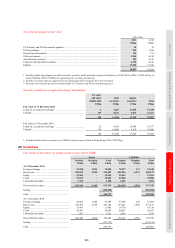
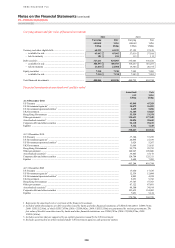
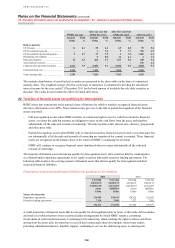
18 Reclassification of financial assets
In 2008, HSBC reclassified US$15.3bn and US$2.6bn of financial assets from the held-for-trading category to the
loans and receivables and available-for-sale classifications, respectively, as permitted by the relevant amendment to
IAS 39 and explained in Note 2(e) on the Financial Statements. No further reclassifications were undertaken.