HSBC 2011 Annual Report Download - page 41
Download and view the complete annual report
Please find page 41 of the 2011 HSBC annual report below. You can navigate through the pages in the report by either clicking on the pages listed below, or by using the keyword search tool below to find specific information within the annual report.-
 1
1 -
2
-
3
-
4
-
5
-
6
-
7
-
8
-
9
-
10
-
11
-
12
-
13
-
14
-
15
-
16
-
17
-
18
-
19
-
20
-
21
-
22
-
23
-
24
-
25
-
26
-
27
-
28
-
29
-
30
-
 31
31 -
 32
32 -
 33
33 -
 34
34 -
 35
35 -
 36
36 -
 37
37 -
 38
38 -
 39
39 -
 40
40 -
 41
41 -
 42
42 -
 43
43 -
 44
44 -
 45
45 -
 46
46 -
 47
47 -
 48
48 -
 49
49 -
 50
50 -
 51
51 -
52
-
53
-
54
-
55
-
56
-
57
-
58
-
59
-
60
-
61
-
62
-
63
-
64
-
65
-
66
-
67
-
68
-
69
-
70
-
71
-
72
-
73
-
74
-
75
-
76
-
77
-
78
-
79
-
80
-
81
-
82
-
83
-
84
-
85
-
86
-
87
-
88
-
89
-
90
-
91
-
92
-
93
-
94
-
95
-
96
-
97
-
98
-
99
-
100
-
101
-
102
-
103
-
104
-
105
-
106
-
107
-
108
-
109
-
110
-
111
-
112
-
113
-
114
-
115
-
116
-
117
-
118
-
119
-
120
-
121
-
122
-
123
-
124
-
125
-
126
-
127
-
128
-
129
-
130
-
131
-
132
-
133
-
134
-
135
-
136
-
137
-
138
-
139
-
140
-
141
-
142
-
143
-
144
-
145
-
146
-
147
-
148
-
149
-
150
-
151
-
152
-
153
-
154
-
155
-
156
-
157
-
158
-
159
-
160
-
161
-
162
-
163
-
164
-
165
-
166
-
167
-
168
-
169
-
170
-
171
-
172
-
173
-
174
-
175
-
176
-
177
-
178
-
179
-
180
-
181
-
182
-
183
-
184
-
185
-
186
-
187
-
188
-
189
-
190
-
191
-
192
-
193
-
194
-
195
-
196
-
197
-
198
-
199
-
200
-
201
-
202
-
203
-
204
-
205
-
206
-
207
-
208
-
209
-
210
-
211
-
212
-
213
-
214
-
215
-
216
-
217
-
218
-
219
-
220
-
221
-
222
-
223
-
224
-
225
-
226
-
227
-
228
-
229
-
230
-
231
-
232
-
233
-
234
-
235
-
236
-
237
-
238
-
239
-
240
-
241
-
242
-
243
-
244
-
245
-
246
-
247
-
248
-
249
-
250
-
251
-
252
-
253
-
254
-
255
-
256
-
257
-
258
-
259
-
260
-
261
-
262
-
263
-
264
-
265
-
266
-
267
-
268
-
269
-
270
-
271
-
272
-
273
-
274
-
275
-
276
-
277
-
278
-
279
-
280
-
281
-
282
-
283
-
284
-
285
-
286
-
287
-
288
-
289
-
290
-
291
-
292
-
293
-
294
-
295
-
296
-
297
-
298
-
299
-
300
-
301
-
302
-
303
-
304
-
305
-
306
-
307
-
308
-
309
-
310
-
311
-
312
-
313
-
314
-
315
-
316
-
317
-
318
-
319
-
320
-
321
-
322
-
323
-
324
-
325
-
326
-
327
-
328
-
329
-
330
-
331
-
332
-
333
-
334
-
335
-
336
-
337
-
338
-
339
-
340
-
341
-
342
-
343
-
344
-
345
-
346
-
347
-
348
-
349
-
350
-
351
-
352
-
353
-
354
-
355
-
356
-
357
-
358
-
359
-
360
-
361
-
362
-
363
-
364
-
365
-
366
-
367
-
368
-
369
-
370
-
371
-
372
-
373
-
374
-
375
-
376
-
377
-
378
-
379
-
380
-
381
-
382
-
383
-
384
-
385
-
386
-
387
-
388
-
389
-
390
-
391
-
392
-
393
-
394
-
395
-
396
-
397
-
398
-
399
-
400
-
401
-
402
-
403
-
404
-
405
-
406
-
407
-
408
-
409
-
410
-
411
-
412
-
413
-
414
-
415
-
416
-
417
-
418
-
419
-
420
-
421
-
422
-
423
-
424
-
425
-
426
-
427
-
428
-
429
-
430
-
431
-
432
-
433
-
434
-
435
-
436
-
437
-
438
-
439
-
440
 |
 |

39
Overview Operating & Financial Review Corporate Governance Financial Statements Shareholder Information
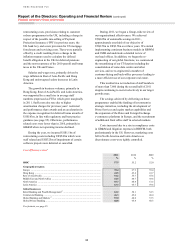
statistical analysis of actual default experience in the
portfolio. Amongst other improvements, this review
resulted in changes to further differentiate the credit
characteristics of forbearance cases, including those
which return to performing status following
forbearance. As part of this review, the application
of the Group accounting policies for the
determination of impairment allowances for the
CML portfolio was considered, in particular
regarding the effect of the large proportion of
renegotiated loans in this portfolio. The consequent
changes did not result in a material change to
impairment allowances recorded by HSBC Finance
under IFRSs. Further information regarding
forbearance activities is disclosed on page 129.
The exercise of judgement requires the use of
assumptions which are highly subjective and very
sensitive to the risk factors, in particular to changes
in economic and credit conditions across a large
number of geographical areas. Many of the factors
have a high degree of interdependency and there is
no single factor to which our loan impairment
allowances as a whole are sensitive. They are
particularly sensitive to general economic and credit
conditions in North America, however. For example,
a 10% increase in impairment allowances on
collectively assessed loans and advances in North
America would increase loan impairment allowances
by US$0.7bn at 31 December 2011 (2010: US$0.9bn).
It is possible that the outcomes within the next
financial year could differ from the assumptions
built into the models, resulting in a material
adjustment to the carrying amount of loans and
advances.
Goodwill impairment
Our accounting policy for goodwill is described in
Note 2p on the Financial Statements. Note 24 on the
Financial Statements lists our cash generating units
(‘CGU’s) by geographical region and global
business. HSBC’s total goodwill amounted to
US$21bn at 31 December 2011 (2010: US$22bn).
The review of goodwill impairment reflects
management’s best estimate of the following factors:
• the future cash flows of the CGUs are sensitive
to the cash flows projected for the periods for
which detailed forecasts are available and to
assumptions regarding the long-term pattern
of sustainable cash flows thereafter. Forecasts
are compared with actual performance and
verifiable economic data, but they necessarily
and appropriately reflect management’s view
of future business prospects at the time of the
assessment; and
• the rates used to discount future expected cash
flows are based on the costs of capital assigned
to individual CGUs and can have a significant
effect on their valuation. The cost of capital
percentage is generally derived from a Capital
Asset Pricing Model, which incorporates inputs
reflecting a number of financial and economic
variables, including the risk-free interest rate in
the country concerned and a premium for the
inherent risk of the business being evaluated.
These variables are subject to fluctuations in
external market rates and economic conditions
beyond our control and are consequently subject
to uncertainty and require the exercise of
significant judgement.
A decline in a CGU’s expected cash flows
and/or an increase in its cost of capital reduces the
CGU’s estimated recoverable amount. If this is
lower than the carrying value of the CGU, a charge
for impairment of goodwill is recognised in our
income statement for the year.
The accuracy of forecast cash flows is subject
to a high degree of uncertainty in volatile market
conditions. In such market conditions, management
retests goodwill for impairment more frequently than
annually to ensure that the assumptions on which the
cash flow forecasts are based continue to reflect
current market conditions and management’s best
estimate of future business prospects.
During 2011, no impairment of goodwill was
identified (2010: nil). In addition to the annual
impairment test which was performed as at 1 July
2011, management reviewed the current and expected
performance of the CGUs as at 31 December 2011
and determined that there was no indication of
potential impairment of the goodwill allocated to
them, except for the GB&M – Europe CGU, which
experienced significantly reduced profitability in the
second half of 2011. The reduced forecast
profitability resulted in a reduction in the recoverable
amount of the CGU when compared to its carrying
amount. Consequently, the results of the goodwill
impairment testing for this CGU are more sensitive to
key assumptions used. Management retested the
goodwill for this CGU and concluded that there was
no impairment.
Note 24 on the Financial Statements includes
details of the CGUs with significant balances of
goodwill, states the key assumptions used to assess
the goodwill in each of those CGUs for impairment
and provides a discussion of the sensitivity of the
carrying value of goodwill to changes in key
assumptions.