HSBC 2011 Annual Report Download - page 155
Download and view the complete annual report
Please find page 155 of the 2011 HSBC annual report below. You can navigate through the pages in the report by either clicking on the pages listed below, or by using the keyword search tool below to find specific information within the annual report.-
 1
1 -
2
-
3
-
4
-
5
-
6
-
7
-
8
-
9
-
10
-
11
-
12
-
13
-
14
-
15
-
16
-
17
-
18
-
19
-
20
-
21
-
22
-
23
-
24
-
25
-
26
-
27
-
28
-
29
-
30
-
31
-
32
-
33
-
34
-
35
-
36
-
37
-
38
-
39
-
40
-
41
-
42
-
43
-
44
-
45
-
46
-
47
-
48
-
49
-
50
-
51
-
52
-
53
-
54
-
55
-
56
-
57
-
58
-
59
-
60
-
61
-
62
-
63
-
64
-
65
-
66
-
67
-
68
-
69
-
70
-
71
-
72
-
73
-
74
-
75
-
76
-
77
-
78
-
79
-
80
-
81
-
82
-
83
-
84
-
85
-
86
-
87
-
88
-
89
-
90
-
91
-
92
-
93
-
94
-
95
-
96
-
97
-
98
-
99
-
100
-
101
-
102
-
103
-
104
-
105
-
106
-
107
-
108
-
109
-
110
-
111
-
112
-
113
-
114
-
115
-
116
-
117
-
118
-
119
-
120
-
121
-
122
-
123
-
124
-
125
-
126
-
127
-
128
-
129
-
130
-
131
-
132
-
133
-
134
-
135
-
136
-
137
-
138
-
139
-
140
-
141
-
142
-
143
-
144
-
 145
145 -
 146
146 -
 147
147 -
 148
148 -
 149
149 -
 150
150 -
 151
151 -
 152
152 -
 153
153 -
 154
154 -
 155
155 -
 156
156 -
 157
157 -
 158
158 -
 159
159 -
 160
160 -
 161
161 -
 162
162 -
 163
163 -
 164
164 -
 165
165 -
166
-
167
-
168
-
169
-
170
-
171
-
172
-
173
-
174
-
175
-
176
-
177
-
178
-
179
-
180
-
181
-
182
-
183
-
184
-
185
-
186
-
187
-
188
-
189
-
190
-
191
-
192
-
193
-
194
-
195
-
196
-
197
-
198
-
199
-
200
-
201
-
202
-
203
-
204
-
205
-
206
-
207
-
208
-
209
-
210
-
211
-
212
-
213
-
214
-
215
-
216
-
217
-
218
-
219
-
220
-
221
-
222
-
223
-
224
-
225
-
226
-
227
-
228
-
229
-
230
-
231
-
232
-
233
-
234
-
235
-
236
-
237
-
238
-
239
-
240
-
241
-
242
-
243
-
244
-
245
-
246
-
247
-
248
-
249
-
250
-
251
-
252
-
253
-
254
-
255
-
256
-
257
-
258
-
259
-
260
-
261
-
262
-
263
-
264
-
265
-
266
-
267
-
268
-
269
-
270
-
271
-
272
-
273
-
274
-
275
-
276
-
277
-
278
-
279
-
280
-
281
-
282
-
283
-
284
-
285
-
286
-
287
-
288
-
289
-
290
-
291
-
292
-
293
-
294
-
295
-
296
-
297
-
298
-
299
-
300
-
301
-
302
-
303
-
304
-
305
-
306
-
307
-
308
-
309
-
310
-
311
-
312
-
313
-
314
-
315
-
316
-
317
-
318
-
319
-
320
-
321
-
322
-
323
-
324
-
325
-
326
-
327
-
328
-
329
-
330
-
331
-
332
-
333
-
334
-
335
-
336
-
337
-
338
-
339
-
340
-
341
-
342
-
343
-
344
-
345
-
346
-
347
-
348
-
349
-
350
-
351
-
352
-
353
-
354
-
355
-
356
-
357
-
358
-
359
-
360
-
361
-
362
-
363
-
364
-
365
-
366
-
367
-
368
-
369
-
370
-
371
-
372
-
373
-
374
-
375
-
376
-
377
-
378
-
379
-
380
-
381
-
382
-
383
-
384
-
385
-
386
-
387
-
388
-
389
-
390
-
391
-
392
-
393
-
394
-
395
-
396
-
397
-
398
-
399
-
400
-
401
-
402
-
403
-
404
-
405
-
406
-
407
-
408
-
409
-
410
-
411
-
412
-
413
-
414
-
415
-
416
-
417
-
418
-
419
-
420
-
421
-
422
-
423
-
424
-
425
-
426
-
427
-
428
-
429
-
430
-
431
-
432
-
433
-
434
-
435
-
436
-
437
-
438
-
439
-
440
 |
 |

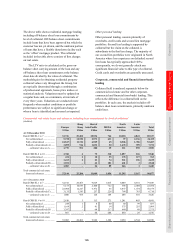
153
Shareholder Information Financial Statements Corporate Governance Operating & Financial Review Overview
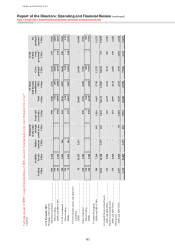
Trading
Available
for sale
Held to
maturity
Designated
at fair value
through
profit or loss
Loans and
receivables Total
Of which
held through
consolidated
SPEs
Gross
principal37
Credit
default
swap
protection38
Net
principal
exposure39
US$m US$m US$m US$m US$m US$m US$m US$m US$m US$m
At 31 December 2010
Mortgage-related assets:
Sub-prime residential ................................... 1,297 2,565 – – 652 4,514 2,763 7,427 348 7,079
Direct lending ........................................... 1,078 – – – – 1,078 632 2,233 – 2,233
MBSs and MBS CDOs ............................ 219 2,565 – – 652 3,436 2,131 5,194 348 4,846
US Alt-A residential ..................................... 180 4,545 191 – 270 5,186 3,651 10,065 100 9,965
Direct lending ........................................... 96 – – – – 96 – 108 – 108
MBSs ........................................................ 84 4,545 191 – 270 5,090 3,651 9,957 100 9,857
US Government agency and sponsored
enterprises:
MBSs ........................................................ 657 21,699 2,032 – – 24,388 6 23,739 – 23,739
Other residential ........................................... 1,075 4,024 – – 1,111 6,210 2,669 6,995 – 6,995
Direct lending ........................................... 417 – – – – 417 – 424 – 424
MBSs ........................................................ 658 4,024 – – 1,111 5,793 2,669 6,571 – 6,571
Commercial property
MBSs and MBS CDOs ............................ 546 8,160 – 111 1,942 10,759 6,441 12,625 421 12,204
3,755 40,993 2,223 111 3,975 51,057 15,530 60,851 869 59,982
Leveraged finance-related assets:
ABSs and ABS CDOs .................................. 392 5,418 – – 414 6,224 3,886 7,148 788 6,360
Student loan-related assets:
ABSs and ABS CDOs .................................. 163 5,178 – – 150 5,491 4,251 7,161 100 7,061
Other assets:
ABSs and ABS CDOs .................................. 1,936 3,103 – 6,017 1,710 12,766 2,526 15,497 7,765 7,732
6,246 54,692 2,223 6,128 6,249 75,538 26,193 90,657 9,522 81,135
For footnotes, see page 185.
The above table excludes leveraged finance transactions, which are shown separately on page 156.