HSBC 2011 Annual Report Download - page 144
Download and view the complete annual report
Please find page 144 of the 2011 HSBC annual report below. You can navigate through the pages in the report by either clicking on the pages listed below, or by using the keyword search tool below to find specific information within the annual report.-
 1
1 -
2
-
3
-
4
-
5
-
6
-
7
-
8
-
9
-
10
-
11
-
12
-
13
-
14
-
15
-
16
-
17
-
18
-
19
-
20
-
21
-
22
-
23
-
24
-
25
-
26
-
27
-
28
-
29
-
30
-
31
-
32
-
33
-
34
-
35
-
36
-
37
-
38
-
39
-
40
-
41
-
42
-
43
-
44
-
45
-
46
-
47
-
48
-
49
-
50
-
51
-
52
-
53
-
54
-
55
-
56
-
57
-
58
-
59
-
60
-
61
-
62
-
63
-
64
-
65
-
66
-
67
-
68
-
69
-
70
-
71
-
72
-
73
-
74
-
75
-
76
-
77
-
78
-
79
-
80
-
81
-
82
-
83
-
84
-
85
-
86
-
87
-
88
-
89
-
90
-
91
-
92
-
93
-
94
-
95
-
96
-
97
-
98
-
99
-
100
-
101
-
102
-
103
-
104
-
105
-
106
-
107
-
108
-
109
-
110
-
111
-
112
-
113
-
114
-
115
-
116
-
117
-
118
-
119
-
120
-
121
-
122
-
123
-
124
-
125
-
126
-
127
-
128
-
129
-
130
-
131
-
132
-
133
-
 134
134 -
 135
135 -
 136
136 -
 137
137 -
 138
138 -
 139
139 -
 140
140 -
 141
141 -
 142
142 -
 143
143 -
 144
144 -
 145
145 -
 146
146 -
 147
147 -
 148
148 -
 149
149 -
 150
150 -
 151
151 -
 152
152 -
 153
153 -
 154
154 -
155
-
156
-
157
-
158
-
159
-
160
-
161
-
162
-
163
-
164
-
165
-
166
-
167
-
168
-
169
-
170
-
171
-
172
-
173
-
174
-
175
-
176
-
177
-
178
-
179
-
180
-
181
-
182
-
183
-
184
-
185
-
186
-
187
-
188
-
189
-
190
-
191
-
192
-
193
-
194
-
195
-
196
-
197
-
198
-
199
-
200
-
201
-
202
-
203
-
204
-
205
-
206
-
207
-
208
-
209
-
210
-
211
-
212
-
213
-
214
-
215
-
216
-
217
-
218
-
219
-
220
-
221
-
222
-
223
-
224
-
225
-
226
-
227
-
228
-
229
-
230
-
231
-
232
-
233
-
234
-
235
-
236
-
237
-
238
-
239
-
240
-
241
-
242
-
243
-
244
-
245
-
246
-
247
-
248
-
249
-
250
-
251
-
252
-
253
-
254
-
255
-
256
-
257
-
258
-
259
-
260
-
261
-
262
-
263
-
264
-
265
-
266
-
267
-
268
-
269
-
270
-
271
-
272
-
273
-
274
-
275
-
276
-
277
-
278
-
279
-
280
-
281
-
282
-
283
-
284
-
285
-
286
-
287
-
288
-
289
-
290
-
291
-
292
-
293
-
294
-
295
-
296
-
297
-
298
-
299
-
300
-
301
-
302
-
303
-
304
-
305
-
306
-
307
-
308
-
309
-
310
-
311
-
312
-
313
-
314
-
315
-
316
-
317
-
318
-
319
-
320
-
321
-
322
-
323
-
324
-
325
-
326
-
327
-
328
-
329
-
330
-
331
-
332
-
333
-
334
-
335
-
336
-
337
-
338
-
339
-
340
-
341
-
342
-
343
-
344
-
345
-
346
-
347
-
348
-
349
-
350
-
351
-
352
-
353
-
354
-
355
-
356
-
357
-
358
-
359
-
360
-
361
-
362
-
363
-
364
-
365
-
366
-
367
-
368
-
369
-
370
-
371
-
372
-
373
-
374
-
375
-
376
-
377
-
378
-
379
-
380
-
381
-
382
-
383
-
384
-
385
-
386
-
387
-
388
-
389
-
390
-
391
-
392
-
393
-
394
-
395
-
396
-
397
-
398
-
399
-
400
-
401
-
402
-
403
-
404
-
405
-
406
-
407
-
408
-
409
-
410
-
411
-
412
-
413
-
414
-
415
-
416
-
417
-
418
-
419
-
420
-
421
-
422
-
423
-
424
-
425
-
426
-
427
-
428
-
429
-
430
-
431
-
432
-
433
-
434
-
435
-
436
-
437
-
438
-
439
-
440
 |
 |

HSBC HOLDINGS PLC
Report of the Directors: Operating and Financial Review (continued)
Risk > Credit risk > Impairment of loans and advances > Impairment charge
142
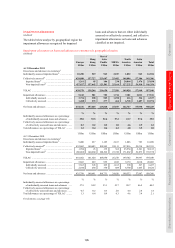
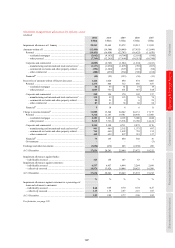
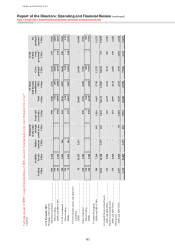
Charge for impairment losses as a percentage of average gross loans and advances to customers by
geographical region
(Unaudited)
Europe
Hong
Kong
Rest of
Asia-
Pacific MENA
North
America
Latin
America Total
% % % % % % %
2011
New allowances net of allowance releases .............. 0.59 0.11 0.38 1.46 4.01 3.54 1.34
Recoveries ................................................................ (0.14) (0.03) (0.15) (0.38) (0.07) (0.61) (0.15)
Total charge for impairment losses .......................... 0.45 0.08 0.23 1.08 3.94 2.93 1.19
Amount written off net of recoveries ....................... 0.52 0.11 0.31 0.32 3.74 2.39 1.14
2010
New allowances net of allowance releases .............. 0.74 0.15 0.66 2.71 4.02 3.41 1.65
Recoveries ................................................................ (0.07) (0.03) (0.20) (0.23) (0.09) (0.51) (0.12)
Total charge for impairment losses .......................... 0.67 0.12 0.46 2.48 3.93 2.90 1.53
Amount written off net of recoveries ....................... 0.71 0.19 0.53 1.32 5.89 4.01 2.08
Loans and advances to customers are excluded
from average balances when reclassified to held for
sale. Including these loans and advances to
customers the North America new allowances net of
allowance releases would be 3.77%, recoveries
0.07%, and amounts written off net of recoveries
3.51%.
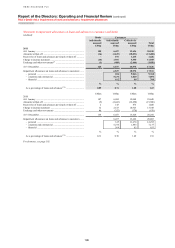
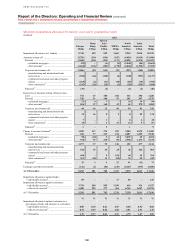
Reconciliation of reported and constant currency changes in impaired loans by geographical region8
(Unaudited)
31 Dec 10
as reported
Constant
currency
effect
31 Dec 10
at 31 Dec 11
exchange
rates
Movement
on a
constant
currency
basis
31 Dec 11
as reported
Reported
change
Movement
on a
constant
currency
basis
US$m US$m US$m US$m US$m % %
Europe ............................................... 11,500 (211) 11,289 530 11,819 3% 5%
Hong Kong ....................................... 665 3 668 (60) 608 (9%) (9%)
Rest of Asia-Pacific .......................... 1,324 (55) 1,269 (199) 1,070 (19%) (16%)
Middle East and North Africa .......... 2,549 (6) 2,543 (98) 2,445 (4%) (4%)
North America .................................. 27,902 (19) 27,883 (5,125) 22,758 (18%) (18%)
Latin America ................................... 3,124 (299) 2,825 214 3,039 (3%) 8%
47,064 (587) 46,477 (4,738) 41,739 (11%) (10%)
For footnote, see page 185.
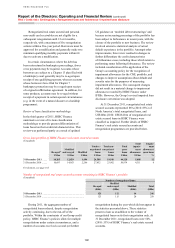
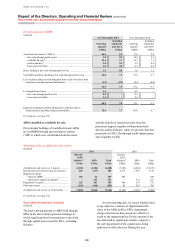
2011 compared with 2010
(Unaudited)
On a reported basis, loan impairment charges to the
income statement of US$11.5bn in 2011 declined by
15% compared with 2010 and by 16% on a constant
currency basis. During 2011, we revised our
disclosure convention for impaired loans for regions
with material levels of forbearance which resulted in
an increase in the population of impaired loans.
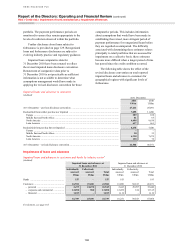
Impaired loan comparative data for 2010 has been
restated to reflect the change in disclosure
convention. On a reported basis our restated
impaired loans were US$41.7bn, 11% lower than at
31 December 2010.
The following commentary is on a constant
currency basis.
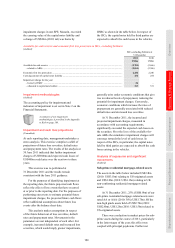
New loan impairment allowances were
US$13.7bn, a decline of 12% compared with 2010,
reflecting lower lending balances in our US
consumer finance portfolios. Releases and recoveries
of US$2.2bn were 17% higher, mainly in Europe and
Latin America reflecting improvements in our
collections operations.
Impaired loans were 4% of total gross loans and
advances at the end of 2011, in line with
31 December 2010.
In Europe, new loan impairment allowances
were US$2.9bn, 14% lower than 2010. Individually
assessed new loan impairment allowances decreased,
mainly in the UK, as the credit quality of our lending
portfolio improved, partly offset by an increase in
allowances in respect of a small number of CMB