HSBC 2011 Annual Report Download - page 383
Download and view the complete annual report
Please find page 383 of the 2011 HSBC annual report below. You can navigate through the pages in the report by either clicking on the pages listed below, or by using the keyword search tool below to find specific information within the annual report.-
 1
1 -
2
-
3
-
4
-
5
-
6
-
7
-
8
-
9
-
10
-
11
-
12
-
13
-
14
-
15
-
16
-
17
-
18
-
19
-
20
-
21
-
22
-
23
-
24
-
25
-
26
-
27
-
28
-
29
-
30
-
31
-
32
-
33
-
34
-
35
-
36
-
37
-
38
-
39
-
40
-
41
-
42
-
43
-
44
-
45
-
46
-
47
-
48
-
49
-
50
-
51
-
52
-
53
-
54
-
55
-
56
-
57
-
58
-
59
-
60
-
61
-
62
-
63
-
64
-
65
-
66
-
67
-
68
-
69
-
70
-
71
-
72
-
73
-
74
-
75
-
76
-
77
-
78
-
79
-
80
-
81
-
82
-
83
-
84
-
85
-
86
-
87
-
88
-
89
-
90
-
91
-
92
-
93
-
94
-
95
-
96
-
97
-
98
-
99
-
100
-
101
-
102
-
103
-
104
-
105
-
106
-
107
-
108
-
109
-
110
-
111
-
112
-
113
-
114
-
115
-
116
-
117
-
118
-
119
-
120
-
121
-
122
-
123
-
124
-
125
-
126
-
127
-
128
-
129
-
130
-
131
-
132
-
133
-
134
-
135
-
136
-
137
-
138
-
139
-
140
-
141
-
142
-
143
-
144
-
145
-
146
-
147
-
148
-
149
-
150
-
151
-
152
-
153
-
154
-
155
-
156
-
157
-
158
-
159
-
160
-
161
-
162
-
163
-
164
-
165
-
166
-
167
-
168
-
169
-
170
-
171
-
172
-
173
-
174
-
175
-
176
-
177
-
178
-
179
-
180
-
181
-
182
-
183
-
184
-
185
-
186
-
187
-
188
-
189
-
190
-
191
-
192
-
193
-
194
-
195
-
196
-
197
-
198
-
199
-
200
-
201
-
202
-
203
-
204
-
205
-
206
-
207
-
208
-
209
-
210
-
211
-
212
-
213
-
214
-
215
-
216
-
217
-
218
-
219
-
220
-
221
-
222
-
223
-
224
-
225
-
226
-
227
-
228
-
229
-
230
-
231
-
232
-
233
-
234
-
235
-
236
-
237
-
238
-
239
-
240
-
241
-
242
-
243
-
244
-
245
-
246
-
247
-
248
-
249
-
250
-
251
-
252
-
253
-
254
-
255
-
256
-
257
-
258
-
259
-
260
-
261
-
262
-
263
-
264
-
265
-
266
-
267
-
268
-
269
-
270
-
271
-
272
-
273
-
274
-
275
-
276
-
277
-
278
-
279
-
280
-
281
-
282
-
283
-
284
-
285
-
286
-
287
-
288
-
289
-
290
-
291
-
292
-
293
-
294
-
295
-
296
-
297
-
298
-
299
-
300
-
301
-
302
-
303
-
304
-
305
-
306
-
307
-
308
-
309
-
310
-
311
-
312
-
313
-
314
-
315
-
316
-
317
-
318
-
319
-
320
-
321
-
322
-
323
-
324
-
325
-
326
-
327
-
328
-
329
-
330
-
331
-
332
-
333
-
334
-
335
-
336
-
337
-
338
-
339
-
340
-
341
-
342
-
343
-
344
-
345
-
346
-
347
-
348
-
349
-
350
-
351
-
352
-
353
-
354
-
355
-
356
-
357
-
358
-
359
-
360
-
361
-
362
-
363
-
364
-
365
-
366
-
367
-
368
-
369
-
370
-
371
-
372
-
 373
373 -
 374
374 -
 375
375 -
 376
376 -
 377
377 -
 378
378 -
 379
379 -
 380
380 -
 381
381 -
 382
382 -
 383
383 -
 384
384 -
 385
385 -
 386
386 -
 387
387 -
 388
388 -
 389
389 -
 390
390 -
 391
391 -
 392
392 -
 393
393 -
394
-
395
-
396
-
397
-
398
-
399
-
400
-
401
-
402
-
403
-
404
-
405
-
406
-
407
-
408
-
409
-
410
-
411
-
412
-
413
-
414
-
415
-
416
-
417
-
418
-
419
-
420
-
421
-
422
-
423
-
424
-
425
-
426
-
427
-
428
-
429
-
430
-
431
-
432
-
433
-
434
-
435
-
436
-
437
-
438
-
439
-
440
 |
 |

381
Overview Operating & Financial Review Corporate Governance Financial Statements Shareholder Information
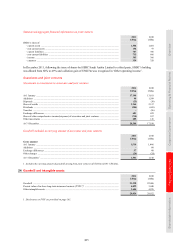
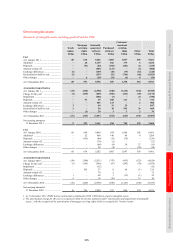
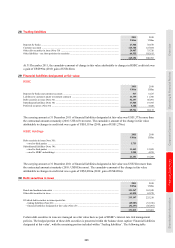
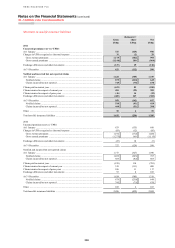
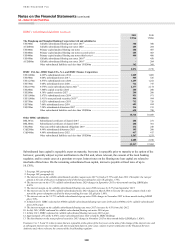
28 Trading liabilities
2011
US$m
2010
US$m
Deposits by banks ..................................................................................................................................... 47,506 38,678
Customer accounts .................................................................................................................................... 123,344 125,684
Other debt securities in issue (Note 30) ................................................................................................... 29,987 33,726
Other liabilities – net short positions in securities ................................................................................... 64,355 102,615
265,192 300,703
At 31 December 2011, the cumulative amount of change in fair value attributable to changes in HSBC credit risk was
a gain of US$599m (2010: gain of US$142m).
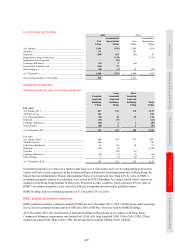
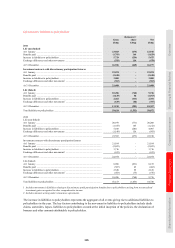
29 Financial liabilities designated at fair value
HSBC
2011 2010
US$m US$m
Deposits by banks and customer accounts ............................................................................................... 517 6,527
Liabilities to customers under investment contracts ................................................................................ 11,399 11,700
Debt securities in issue (Note 30) ............................................................................................................. 52,197 46,091
Subordinated liabilities (Note 34) ............................................................................................................ 17,503 19,395
Preferred securities (Note 34) ................................................................................................................... 4,108 4,420
85,724 88,133
The carrying amount at 31 December 2011 of financial liabilities designated at fair value was US$1,377m more than
the contractual amount at maturity (2010: US$1,631m more). The cumulative amount of the change in fair value
attributable to changes in credit risk was a gain of US$5,118m (2010: gain of US$1,279m).
HSBC Holdings
2011 2010
US$m US$m
Debt securities in issue (Note 30):
– owed to third parties .......................................................................................................................... 5,753 –
Subordinated liabilities (Note 34):
– owed to third parties .......................................................................................................................... 11,443 12,029
– owed to HSBC undertakings ............................................................................................................. 3,955 4,259
21,151 16,288
The carrying amount at 31 December 2011 of financial liabilities designated at fair value was US$722m more than
the contractual amount at maturity (2010: US$855m more). The cumulative amount of the change in fair value
attributable to changes in credit risk was a gain of US$2,096m (2010: gain of US$439m).
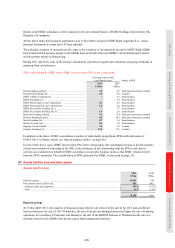
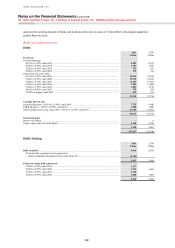
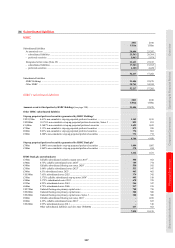
30 Debt securities in issue
2011 2010
US$m US$m
Bonds and medium-term notes ................................................................................................................. 151,367 162,948
Other debt securities in issue .................................................................................................................... 61,830 62,270
213,197 225,218
Of which debt securities in issue reported as:
– trading liabilities (Note 28) ............................................................................................................... (29,987) (33,726)
– financial liabilities designated at fair value (Note 29) ...................................................................... (52,197) (46,091)
131,013 145,401
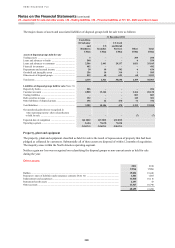
Certain debt securities in issue are managed on a fair value basis as part of HSBC’s interest rate risk management
policies. The hedged portion of these debt securities is presented within the balance sheet caption ‘Financial liabilities
designated at fair value’, with the remaining portion included within ‘Trading liabilities’. The following table