HSBC 2011 Annual Report Download - page 166
Download and view the complete annual report
Please find page 166 of the 2011 HSBC annual report below. You can navigate through the pages in the report by either clicking on the pages listed below, or by using the keyword search tool below to find specific information within the annual report.-
 1
1 -
2
-
3
-
4
-
5
-
6
-
7
-
8
-
9
-
10
-
11
-
12
-
13
-
14
-
15
-
16
-
17
-
18
-
19
-
20
-
21
-
22
-
23
-
24
-
25
-
26
-
27
-
28
-
29
-
30
-
31
-
32
-
33
-
34
-
35
-
36
-
37
-
38
-
39
-
40
-
41
-
42
-
43
-
44
-
45
-
46
-
47
-
48
-
49
-
50
-
51
-
52
-
53
-
54
-
55
-
56
-
57
-
58
-
59
-
60
-
61
-
62
-
63
-
64
-
65
-
66
-
67
-
68
-
69
-
70
-
71
-
72
-
73
-
74
-
75
-
76
-
77
-
78
-
79
-
80
-
81
-
82
-
83
-
84
-
85
-
86
-
87
-
88
-
89
-
90
-
91
-
92
-
93
-
94
-
95
-
96
-
97
-
98
-
99
-
100
-
101
-
102
-
103
-
104
-
105
-
106
-
107
-
108
-
109
-
110
-
111
-
112
-
113
-
114
-
115
-
116
-
117
-
118
-
119
-
120
-
121
-
122
-
123
-
124
-
125
-
126
-
127
-
128
-
129
-
130
-
131
-
132
-
133
-
134
-
135
-
136
-
137
-
138
-
139
-
140
-
141
-
142
-
143
-
144
-
145
-
146
-
147
-
148
-
149
-
150
-
151
-
152
-
153
-
154
-
155
-
 156
156 -
 157
157 -
 158
158 -
 159
159 -
 160
160 -
 161
161 -
 162
162 -
 163
163 -
 164
164 -
 165
165 -
 166
166 -
 167
167 -
 168
168 -
 169
169 -
 170
170 -
 171
171 -
 172
172 -
 173
173 -
 174
174 -
 175
175 -
 176
176 -
177
-
178
-
179
-
180
-
181
-
182
-
183
-
184
-
185
-
186
-
187
-
188
-
189
-
190
-
191
-
192
-
193
-
194
-
195
-
196
-
197
-
198
-
199
-
200
-
201
-
202
-
203
-
204
-
205
-
206
-
207
-
208
-
209
-
210
-
211
-
212
-
213
-
214
-
215
-
216
-
217
-
218
-
219
-
220
-
221
-
222
-
223
-
224
-
225
-
226
-
227
-
228
-
229
-
230
-
231
-
232
-
233
-
234
-
235
-
236
-
237
-
238
-
239
-
240
-
241
-
242
-
243
-
244
-
245
-
246
-
247
-
248
-
249
-
250
-
251
-
252
-
253
-
254
-
255
-
256
-
257
-
258
-
259
-
260
-
261
-
262
-
263
-
264
-
265
-
266
-
267
-
268
-
269
-
270
-
271
-
272
-
273
-
274
-
275
-
276
-
277
-
278
-
279
-
280
-
281
-
282
-
283
-
284
-
285
-
286
-
287
-
288
-
289
-
290
-
291
-
292
-
293
-
294
-
295
-
296
-
297
-
298
-
299
-
300
-
301
-
302
-
303
-
304
-
305
-
306
-
307
-
308
-
309
-
310
-
311
-
312
-
313
-
314
-
315
-
316
-
317
-
318
-
319
-
320
-
321
-
322
-
323
-
324
-
325
-
326
-
327
-
328
-
329
-
330
-
331
-
332
-
333
-
334
-
335
-
336
-
337
-
338
-
339
-
340
-
341
-
342
-
343
-
344
-
345
-
346
-
347
-
348
-
349
-
350
-
351
-
352
-
353
-
354
-
355
-
356
-
357
-
358
-
359
-
360
-
361
-
362
-
363
-
364
-
365
-
366
-
367
-
368
-
369
-
370
-
371
-
372
-
373
-
374
-
375
-
376
-
377
-
378
-
379
-
380
-
381
-
382
-
383
-
384
-
385
-
386
-
387
-
388
-
389
-
390
-
391
-
392
-
393
-
394
-
395
-
396
-
397
-
398
-
399
-
400
-
401
-
402
-
403
-
404
-
405
-
406
-
407
-
408
-
409
-
410
-
411
-
412
-
413
-
414
-
415
-
416
-
417
-
418
-
419
-
420
-
421
-
422
-
423
-
424
-
425
-
426
-
427
-
428
-
429
-
430
-
431
-
432
-
433
-
434
-
435
-
436
-
437
-
438
-
439
-
440
 |
 |

HSBC HOLDINGS PLC
Report of the Directors: Operating and Financial Review (continued)
Risk > Market risk > Trading and non-trading portfolios
164
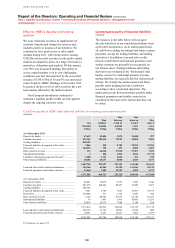
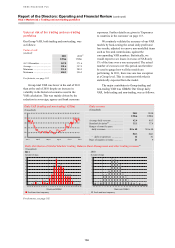
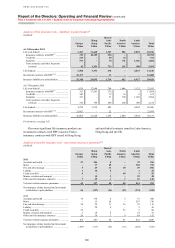
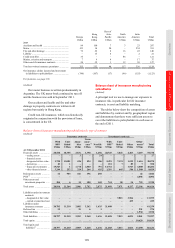
Value at risk of the trading and non-trading
portfolios
Our Group VAR, both trading and non-trading, was
as follows:
Value at risk
(Audited)
2011 201057
US$m US$m
At 31 December ................... 367.0 371.6
Average ................................ 301.6 357.5
Minimum ............................. 231.5 205.3
Maximum ............................. 404.3 556.3
For footnote, see page 185.
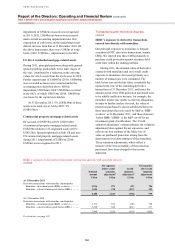
Group total VAR was lower at the end of 2011
than at the end of 2010 despite an increase in
volatility in the historical scenarios used in the
VAR calculation. This was mainly driven by the
reduction in sovereign, agency and bank eurozone
exposures. Further details are given in ‘Exposures
to countries in the eurozone’ on page 113.
We routinely validate the accuracy of our VAR
models by back-testing the actual daily profit and
loss results, adjusted to remove non-modelled items
such as fees and commissions, against the
corresponding VAR numbers. Statistically, we
would expect to see losses in excess of VAR only
1% of the time over a one-year period. The actual
number of excesses over this period can therefore
be used to gauge how well the models are
performing. In 2011, there was one loss exception
at a Group level. This is consistent with what is
statistically expected from the model.
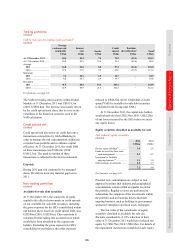
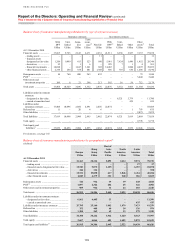
The major contributor to Group trading and
non-trading VAR was GB&M. Our Group daily
VAR, both trading and non-trading, was as follows:
Daily VAR (trading and non-trading) (US$m) Daily revenue
(Unaudited) (Unaudited)
200
250
300
350
400
450
Jan-11 Mar-11 May-11 Aug-11 Oct-11 Dec-11
2011 2010
US$m US$m
Average daily revenue ................... 42.4 49.3
Standard deviation58 ...................... 35.1 37.8
Ranges of most frequent
daily revenues ........................... 30 to 40 30 to 40
days days
– daily occurrences .................. 42 41
Days of negative revenue .............. 23 9
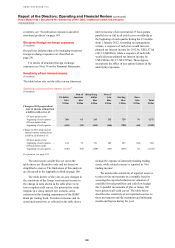
Daily distribution of Global Markets’ trading, Balance Sheet Management and other trading revenues59
(Unaudited)
2011 2010
Number of days Number of days
10
2
5
01
7
4
3
11
17
29
42
29 31
28
14 14 14
6
11
0
5
10
15
20
25
30
35
40
45
-90 -80 -70 -60 -50 -40 -30 -20 -10 0 10 20 30 40 50 60 70 80 90 100 110 120 150 160
1
3
2
3
4
6
12
17
32
37
40
41
23
1515
4
2
3
0
5
10
15
20
25
30
35
40
45
-30 -20 -10 0 10 20 30 40 50 60 70 80 90 100 110 120 130 140 440 450
Revenues (US$m) Revenues (US$m)
Profit and loss frequency Profit and loss frequency
For footnotes, see page 185.