HSBC 2011 Annual Report Download - page 109
Download and view the complete annual report
Please find page 109 of the 2011 HSBC annual report below. You can navigate through the pages in the report by either clicking on the pages listed below, or by using the keyword search tool below to find specific information within the annual report.-
 1
1 -
2
-
3
-
4
-
5
-
6
-
7
-
8
-
9
-
10
-
11
-
12
-
13
-
14
-
15
-
16
-
17
-
18
-
19
-
20
-
21
-
22
-
23
-
24
-
25
-
26
-
27
-
28
-
29
-
30
-
31
-
32
-
33
-
34
-
35
-
36
-
37
-
38
-
39
-
40
-
41
-
42
-
43
-
44
-
45
-
46
-
47
-
48
-
49
-
50
-
51
-
52
-
53
-
54
-
55
-
56
-
57
-
58
-
59
-
60
-
61
-
62
-
63
-
64
-
65
-
66
-
67
-
68
-
69
-
70
-
71
-
72
-
73
-
74
-
75
-
76
-
77
-
78
-
79
-
80
-
81
-
82
-
83
-
84
-
85
-
86
-
87
-
88
-
89
-
90
-
91
-
92
-
93
-
94
-
95
-
96
-
97
-
98
-
 99
99 -
 100
100 -
 101
101 -
 102
102 -
 103
103 -
 104
104 -
 105
105 -
 106
106 -
 107
107 -
 108
108 -
 109
109 -
 110
110 -
 111
111 -
 112
112 -
 113
113 -
 114
114 -
 115
115 -
 116
116 -
 117
117 -
 118
118 -
 119
119 -
120
-
121
-
122
-
123
-
124
-
125
-
126
-
127
-
128
-
129
-
130
-
131
-
132
-
133
-
134
-
135
-
136
-
137
-
138
-
139
-
140
-
141
-
142
-
143
-
144
-
145
-
146
-
147
-
148
-
149
-
150
-
151
-
152
-
153
-
154
-
155
-
156
-
157
-
158
-
159
-
160
-
161
-
162
-
163
-
164
-
165
-
166
-
167
-
168
-
169
-
170
-
171
-
172
-
173
-
174
-
175
-
176
-
177
-
178
-
179
-
180
-
181
-
182
-
183
-
184
-
185
-
186
-
187
-
188
-
189
-
190
-
191
-
192
-
193
-
194
-
195
-
196
-
197
-
198
-
199
-
200
-
201
-
202
-
203
-
204
-
205
-
206
-
207
-
208
-
209
-
210
-
211
-
212
-
213
-
214
-
215
-
216
-
217
-
218
-
219
-
220
-
221
-
222
-
223
-
224
-
225
-
226
-
227
-
228
-
229
-
230
-
231
-
232
-
233
-
234
-
235
-
236
-
237
-
238
-
239
-
240
-
241
-
242
-
243
-
244
-
245
-
246
-
247
-
248
-
249
-
250
-
251
-
252
-
253
-
254
-
255
-
256
-
257
-
258
-
259
-
260
-
261
-
262
-
263
-
264
-
265
-
266
-
267
-
268
-
269
-
270
-
271
-
272
-
273
-
274
-
275
-
276
-
277
-
278
-
279
-
280
-
281
-
282
-
283
-
284
-
285
-
286
-
287
-
288
-
289
-
290
-
291
-
292
-
293
-
294
-
295
-
296
-
297
-
298
-
299
-
300
-
301
-
302
-
303
-
304
-
305
-
306
-
307
-
308
-
309
-
310
-
311
-
312
-
313
-
314
-
315
-
316
-
317
-
318
-
319
-
320
-
321
-
322
-
323
-
324
-
325
-
326
-
327
-
328
-
329
-
330
-
331
-
332
-
333
-
334
-
335
-
336
-
337
-
338
-
339
-
340
-
341
-
342
-
343
-
344
-
345
-
346
-
347
-
348
-
349
-
350
-
351
-
352
-
353
-
354
-
355
-
356
-
357
-
358
-
359
-
360
-
361
-
362
-
363
-
364
-
365
-
366
-
367
-
368
-
369
-
370
-
371
-
372
-
373
-
374
-
375
-
376
-
377
-
378
-
379
-
380
-
381
-
382
-
383
-
384
-
385
-
386
-
387
-
388
-
389
-
390
-
391
-
392
-
393
-
394
-
395
-
396
-
397
-
398
-
399
-
400
-
401
-
402
-
403
-
404
-
405
-
406
-
407
-
408
-
409
-
410
-
411
-
412
-
413
-
414
-
415
-
416
-
417
-
418
-
419
-
420
-
421
-
422
-
423
-
424
-
425
-
426
-
427
-
428
-
429
-
430
-
431
-
432
-
433
-
434
-
435
-
436
-
437
-
438
-
439
-
440
 |
 |

107
Overview Operating & Financial Review Corporate Governance Financial Statements Shareholder Information
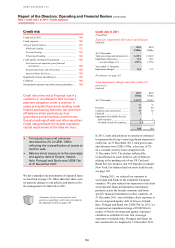
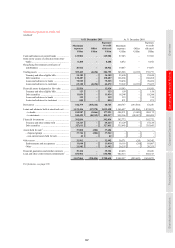
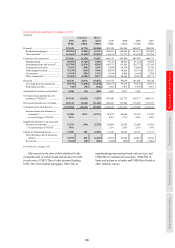
Maximum exposure to credit risk
(Audited)
At 31 December 2011 At 31 December 2010
Maximum
exposure
Offset
Exposure
to credit
risk (net)
Maximum
exposure
Offset
Exposure
to credit
risk (net)
US$m US$m US$m US$m US$m US$m
Cash and balances at central banks .................... 129,902 – 129,902 57,383 – 57,383
Items in the course of collection from other
banks ............................................................... 8,208 – 8,208 6,072 – 6,072
Hong Kong Government certificates of
indebtedness ................................................... 20,922 – 20,922 19,057 – 19,057
Trading assets ..................................................... 309,449 (4,656) 304,793 343,966 (4,189) 339,777
Treasury and other eligible bills ..................... 34,309 –34,309 25,620 – 25,620
Debt securities ................................................ 130,487 –130,487 168,268 – 168,268
Loans and advances to banks ......................... 75,525 –75,525 70,456 – 70,456
Loans and advances to customers .................. 69,128 (4,656) 64,472 79,622 (4,189) 75,433
Financial assets designated at fair value ............ 12,926 – 12,926 19,593 – 19,593
Treasury and other eligible bills ..................... 123 –123 159 – 159
Debt securities ................................................ 11,834 –11,834 18,248 – 18,248
Loans and advances to banks ......................... 119 –119 315 – 315
Loans and advances to customers .................. 850 –850 871 – 871
Derivatives .......................................................... 346,379 (305,616) 40,763 260,757 (197,501) 63,256
Loans and advances held at amortised cost ........ 1,121,416 (87,978) 1,033,438 1,166,637 (91,966) 1,074,671
– to banks ........................................................ 180,987 (3,066) 177,921 208,271 (3,099) 205,172
– to customers ................................................. 940,429 (84,912) 855,517 958,366 (88,867) 869,499
Financial investments ......................................... 392,834 – 392,834 392,772 – 392,772
Treasury and other similar bills ...................... 65,223 –65,223 57,129 – 57,129
Debt securities ................................................ 327,611 –327,611 335,643 – 335,643
Assets held for sale2 ............................................ 37,808 (204) 37,604 – – –
– disposal groups ............................................ 37,746 (204) 37,542 – – –
– non-current assets held for sale ................... 62 –62 – – –
Other assets ......................................................... 32,992 – 32,992 30,371 (29) 30,342
Endorsements and acceptances ...................... 11,010 –11,010 10,116 (29) 10,087
Other ............................................................... 21,982 –21,982 20,255 – 20,255
Financial guarantees and similar contracts ........ 39,324 – 39,324 49,436 – 49,436
Loan and other credit-related commitments3 ..... 654,904 – 654,904 602,513 – 602,513
3,107,064 (398,454) 2,708,610 2,948,557 (293,685) 2,654,872
For footnotes, see page 185.