HSBC 2011 Annual Report Download - page 136
Download and view the complete annual report
Please find page 136 of the 2011 HSBC annual report below. You can navigate through the pages in the report by either clicking on the pages listed below, or by using the keyword search tool below to find specific information within the annual report.-
 1
1 -
2
-
3
-
4
-
5
-
6
-
7
-
8
-
9
-
10
-
11
-
12
-
13
-
14
-
15
-
16
-
17
-
18
-
19
-
20
-
21
-
22
-
23
-
24
-
25
-
26
-
27
-
28
-
29
-
30
-
31
-
32
-
33
-
34
-
35
-
36
-
37
-
38
-
39
-
40
-
41
-
42
-
43
-
44
-
45
-
46
-
47
-
48
-
49
-
50
-
51
-
52
-
53
-
54
-
55
-
56
-
57
-
58
-
59
-
60
-
61
-
62
-
63
-
64
-
65
-
66
-
67
-
68
-
69
-
70
-
71
-
72
-
73
-
74
-
75
-
76
-
77
-
78
-
79
-
80
-
81
-
82
-
83
-
84
-
85
-
86
-
87
-
88
-
89
-
90
-
91
-
92
-
93
-
94
-
95
-
96
-
97
-
98
-
99
-
100
-
101
-
102
-
103
-
104
-
105
-
106
-
107
-
108
-
109
-
110
-
111
-
112
-
113
-
114
-
115
-
116
-
117
-
118
-
119
-
120
-
121
-
122
-
123
-
124
-
125
-
 126
126 -
 127
127 -
 128
128 -
 129
129 -
 130
130 -
 131
131 -
 132
132 -
 133
133 -
 134
134 -
 135
135 -
 136
136 -
 137
137 -
 138
138 -
 139
139 -
 140
140 -
 141
141 -
 142
142 -
 143
143 -
 144
144 -
 145
145 -
 146
146 -
147
-
148
-
149
-
150
-
151
-
152
-
153
-
154
-
155
-
156
-
157
-
158
-
159
-
160
-
161
-
162
-
163
-
164
-
165
-
166
-
167
-
168
-
169
-
170
-
171
-
172
-
173
-
174
-
175
-
176
-
177
-
178
-
179
-
180
-
181
-
182
-
183
-
184
-
185
-
186
-
187
-
188
-
189
-
190
-
191
-
192
-
193
-
194
-
195
-
196
-
197
-
198
-
199
-
200
-
201
-
202
-
203
-
204
-
205
-
206
-
207
-
208
-
209
-
210
-
211
-
212
-
213
-
214
-
215
-
216
-
217
-
218
-
219
-
220
-
221
-
222
-
223
-
224
-
225
-
226
-
227
-
228
-
229
-
230
-
231
-
232
-
233
-
234
-
235
-
236
-
237
-
238
-
239
-
240
-
241
-
242
-
243
-
244
-
245
-
246
-
247
-
248
-
249
-
250
-
251
-
252
-
253
-
254
-
255
-
256
-
257
-
258
-
259
-
260
-
261
-
262
-
263
-
264
-
265
-
266
-
267
-
268
-
269
-
270
-
271
-
272
-
273
-
274
-
275
-
276
-
277
-
278
-
279
-
280
-
281
-
282
-
283
-
284
-
285
-
286
-
287
-
288
-
289
-
290
-
291
-
292
-
293
-
294
-
295
-
296
-
297
-
298
-
299
-
300
-
301
-
302
-
303
-
304
-
305
-
306
-
307
-
308
-
309
-
310
-
311
-
312
-
313
-
314
-
315
-
316
-
317
-
318
-
319
-
320
-
321
-
322
-
323
-
324
-
325
-
326
-
327
-
328
-
329
-
330
-
331
-
332
-
333
-
334
-
335
-
336
-
337
-
338
-
339
-
340
-
341
-
342
-
343
-
344
-
345
-
346
-
347
-
348
-
349
-
350
-
351
-
352
-
353
-
354
-
355
-
356
-
357
-
358
-
359
-
360
-
361
-
362
-
363
-
364
-
365
-
366
-
367
-
368
-
369
-
370
-
371
-
372
-
373
-
374
-
375
-
376
-
377
-
378
-
379
-
380
-
381
-
382
-
383
-
384
-
385
-
386
-
387
-
388
-
389
-
390
-
391
-
392
-
393
-
394
-
395
-
396
-
397
-
398
-
399
-
400
-
401
-
402
-
403
-
404
-
405
-
406
-
407
-
408
-
409
-
410
-
411
-
412
-
413
-
414
-
415
-
416
-
417
-
418
-
419
-
420
-
421
-
422
-
423
-
424
-
425
-
426
-
427
-
428
-
429
-
430
-
431
-
432
-
433
-
434
-
435
-
436
-
437
-
438
-
439
-
440
 |
 |

HSBC HOLDINGS PLC
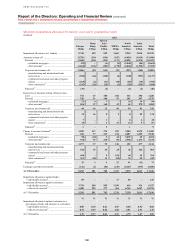
Report of the Directors: Operating and Financial Review (continued)
Risk > Credit risk > Impairment of loans and advances > Impairment allowances
134
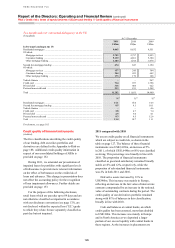
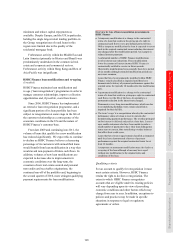
portfolio. The payment performance periods are
monitored to ensure they remain appropriate to the
levels of recidivism observed within the portfolio.
Further disclosure about loans subject to
forbearance is provided on page 129. Renegotiated
loans and forbearance disclosures are subject to
evolving industry practice and regulatory guidance.
Impaired loan comparative data for
31 December 2010 have been restated to reflect
the revised impaired loans disclosure convention.
Restatement of comparative data prior to
31 December 2010 is not practicable as sufficient
information is not available to determine what
assumptions management would have made in
applying the revised disclosure convention for those
comparative periods. This includes information
about assumptions that would have been made in
establishing the revised, more stringent period of
payment performance for renegotiated loans before
they are regarded as unimpaired. The difficulty
associated with determining these estimates relates
principally to retail portfolios that are assessed for
impairment on a collective basis; these estimates
become more difficult when a longer period of time
has passed since the credit condition occurred.
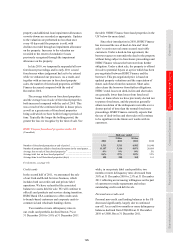
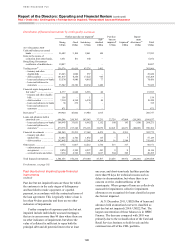
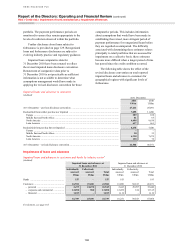
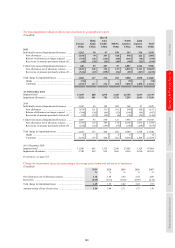
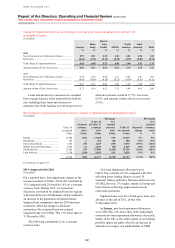
The following table shows the effect of the
revised disclosure convention on total reported
impaired loans and advances to customers for
geographical regions with significant levels of
forbearance.
Impaired loans and advances to customers
(Audited)
At 31 December
2011 2010
US$m US$m
At 31 December – previous disclosure convention ................................................................................. 27,211 28,091
Reclassified from neither past due nor impaired ..................................................................................... 7,895 11,200
Europe .................................................................................................................................................. 509 838
Middle East and North Africa ............................................................................................................. 61 63
North America ..................................................................................................................................... 6,688 9,638
Latin America ...................................................................................................................................... 637 661
Reclassified from past due but not impaired ............................................................................................ 6,478 7,580
Europe .................................................................................................................................................. – –
Middle East and North Africa ............................................................................................................. 30 33
North America ..................................................................................................................................... 6,310 7,475
Latin America ...................................................................................................................................... 138 72
At 31 December – revised disclosure convention .................................................................................... 41,584 46,871
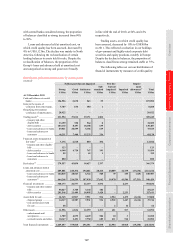
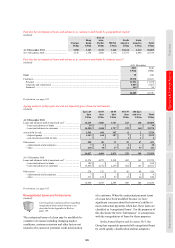
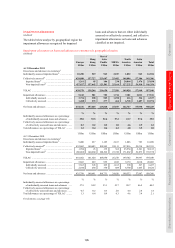
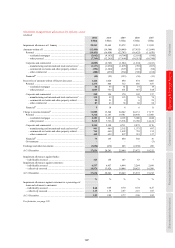
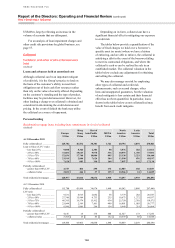
Impairment of loans and advances
Impaired loans and advances to customers and banks by industry sector8
(Audited)
Impaired loans and advances at
31 December 2011
Impaired loans and advances at
31 December 2010
Individually
assessed
Collectively
assessed
Total
Individually
assessed
Collectively
assessed
Total
US$m US$m US$m US$m US$m US$m
Banks .......................................................... 155 – 155 193 – 193
Customers ................................................... 16,554 25,030 41,584 16,058 30,813 46,871
– personal .............................................. 2,473 24,070 26,543 2,443 29,997 32,440
– corporate and commercial .................. 12,898 960 13,858 12,499 816 13,315
– financial .............................................. 1,183 –1,183 1,116 – 1,116
16,709 25,030 41,739 16,251 30,813 47,064
For footnote, see page 185.