HSBC 2011 Annual Report Download - page 395
Download and view the complete annual report
Please find page 395 of the 2011 HSBC annual report below. You can navigate through the pages in the report by either clicking on the pages listed below, or by using the keyword search tool below to find specific information within the annual report.-
 1
1 -
2
-
3
-
4
-
5
-
6
-
7
-
8
-
9
-
10
-
11
-
12
-
13
-
14
-
15
-
16
-
17
-
18
-
19
-
20
-
21
-
22
-
23
-
24
-
25
-
26
-
27
-
28
-
29
-
30
-
31
-
32
-
33
-
34
-
35
-
36
-
37
-
38
-
39
-
40
-
41
-
42
-
43
-
44
-
45
-
46
-
47
-
48
-
49
-
50
-
51
-
52
-
53
-
54
-
55
-
56
-
57
-
58
-
59
-
60
-
61
-
62
-
63
-
64
-
65
-
66
-
67
-
68
-
69
-
70
-
71
-
72
-
73
-
74
-
75
-
76
-
77
-
78
-
79
-
80
-
81
-
82
-
83
-
84
-
85
-
86
-
87
-
88
-
89
-
90
-
91
-
92
-
93
-
94
-
95
-
96
-
97
-
98
-
99
-
100
-
101
-
102
-
103
-
104
-
105
-
106
-
107
-
108
-
109
-
110
-
111
-
112
-
113
-
114
-
115
-
116
-
117
-
118
-
119
-
120
-
121
-
122
-
123
-
124
-
125
-
126
-
127
-
128
-
129
-
130
-
131
-
132
-
133
-
134
-
135
-
136
-
137
-
138
-
139
-
140
-
141
-
142
-
143
-
144
-
145
-
146
-
147
-
148
-
149
-
150
-
151
-
152
-
153
-
154
-
155
-
156
-
157
-
158
-
159
-
160
-
161
-
162
-
163
-
164
-
165
-
166
-
167
-
168
-
169
-
170
-
171
-
172
-
173
-
174
-
175
-
176
-
177
-
178
-
179
-
180
-
181
-
182
-
183
-
184
-
185
-
186
-
187
-
188
-
189
-
190
-
191
-
192
-
193
-
194
-
195
-
196
-
197
-
198
-
199
-
200
-
201
-
202
-
203
-
204
-
205
-
206
-
207
-
208
-
209
-
210
-
211
-
212
-
213
-
214
-
215
-
216
-
217
-
218
-
219
-
220
-
221
-
222
-
223
-
224
-
225
-
226
-
227
-
228
-
229
-
230
-
231
-
232
-
233
-
234
-
235
-
236
-
237
-
238
-
239
-
240
-
241
-
242
-
243
-
244
-
245
-
246
-
247
-
248
-
249
-
250
-
251
-
252
-
253
-
254
-
255
-
256
-
257
-
258
-
259
-
260
-
261
-
262
-
263
-
264
-
265
-
266
-
267
-
268
-
269
-
270
-
271
-
272
-
273
-
274
-
275
-
276
-
277
-
278
-
279
-
280
-
281
-
282
-
283
-
284
-
285
-
286
-
287
-
288
-
289
-
290
-
291
-
292
-
293
-
294
-
295
-
296
-
297
-
298
-
299
-
300
-
301
-
302
-
303
-
304
-
305
-
306
-
307
-
308
-
309
-
310
-
311
-
312
-
313
-
314
-
315
-
316
-
317
-
318
-
319
-
320
-
321
-
322
-
323
-
324
-
325
-
326
-
327
-
328
-
329
-
330
-
331
-
332
-
333
-
334
-
335
-
336
-
337
-
338
-
339
-
340
-
341
-
342
-
343
-
344
-
345
-
346
-
347
-
348
-
349
-
350
-
351
-
352
-
353
-
354
-
355
-
356
-
357
-
358
-
359
-
360
-
361
-
362
-
363
-
364
-
365
-
366
-
367
-
368
-
369
-
370
-
371
-
372
-
373
-
374
-
375
-
376
-
377
-
378
-
379
-
380
-
381
-
382
-
383
-
384
-
 385
385 -
 386
386 -
 387
387 -
 388
388 -
 389
389 -
 390
390 -
 391
391 -
 392
392 -
 393
393 -
 394
394 -
 395
395 -
 396
396 -
 397
397 -
 398
398 -
 399
399 -
 400
400 -
 401
401 -
 402
402 -
 403
403 -
 404
404 -
 405
405 -
406
-
407
-
408
-
409
-
410
-
411
-
412
-
413
-
414
-
415
-
416
-
417
-
418
-
419
-
420
-
421
-
422
-
423
-
424
-
425
-
426
-
427
-
428
-
429
-
430
-
431
-
432
-
433
-
434
-
435
-
436
-
437
-
438
-
439
-
440
 |
 |

393
Overview Operating & Financial Review Corporate Governance Financial Statements Shareholder Information
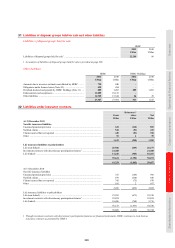
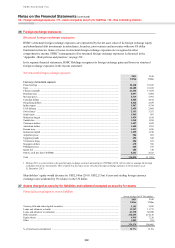
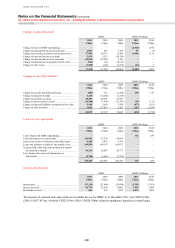
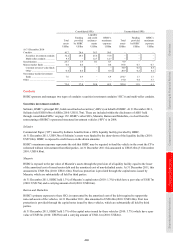
The financial assets above represent the Group’s encumbered assets on an IFRSs basis. For further details refer to
‘Liquidity and funding risk’ on page 160. Of the financial assets pledged to secure liabilities, the most significant
amounts are located in the following geographical regions:
Assets pledged at 31 December
2011 2010
US$m US$m
North America .......................................................................................................................................... 58,086 53,472
Europe ....................................................................................................................................................... 245,171 227,177
303,257 280,649
These transactions are conducted under terms that are usual and customary to collateralised transactions, including,
where relevant, standard securities lending and repurchase agreements.
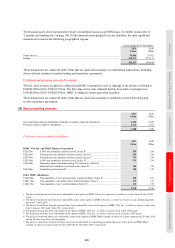
Collateral accepted as security for assets
The fair value of assets accepted as collateral that HSBC is permitted to sell or repledge in the absence of default is
US$302,285m (2010: US$333,921m). The fair value of any such collateral that has been sold or repledged was
US$188,682m (2010: US$205,470m). HSBC is obliged to return equivalent securities.
These transactions are conducted under terms that are usual and customary to standard securities borrowing and
reverse repurchase agreements.
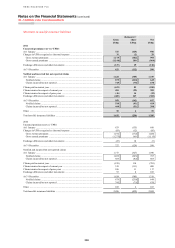
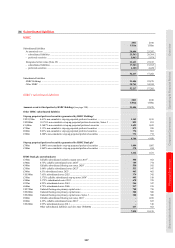
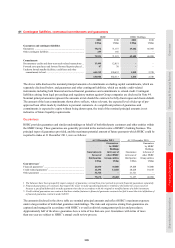
38 Non-controlling interests
2011 2010
US$m US$m
Non-controlling interests attributable to holders of ordinary shares in subsidiaries ............................... 4,656 4,522
Preference shares issued by subsidiaries .................................................................................................. 2,712 2,726
7,368 7,248
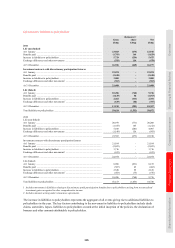
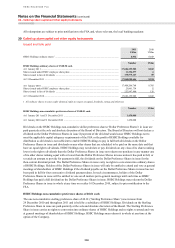
Preference shares issued by subsidiaries
2011 2010
US$m US$m
HSBC USA Inc. and HSBC Finance Corporation
US$575m 6.36% non-cumulative preferred stock, Series B1 ....................................................... 559 559
US$518m Floating rate non-cumulative preferred stock, Series F2 ............................................. 518 518
US$374m Floating rate non-cumulative preferred stock, Series G3 ............................................. 374 374
US$374m 6.50% non-cumulative preferred stock, Series H3 ....................................................... 374 374
US$150m
Depositary shares each representing 25% interest in a share of
adjustable-rate cumulative preferred stock, Series D4 ................................................. 150 150
US$150m Cumulative preferred stock5 ........................................................................................ 150 150
Other HSBC subsidiaries
CAD250m Non-cumulative 5 year rate reset class 1 preferred shares, Series E6 .......................... 245 251
CAD175m Non-cumulative redeemable class 1 preferred shares, Series C7 ................................. 171 175
CAD175m Non-cumulative class 1 preferred shares, Series D7 .................................................... 171 175
2,712 2,726
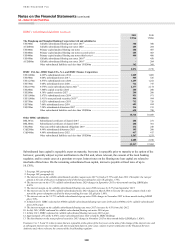
1 The Series B preferred stock has been redeemable at the option of HSBC Finance Corporation, in whole or in part, from 24 June 2010
at par.
2 The Series F preferred stock has been redeemable at par at the option of HSBC USA, Inc., in whole or in part, on any dividend payment
date from 7 April 2010.
3 The Series G and Series H preferred stock have been redeemable at par at the option of HSBC USA, Inc., in whole or in part, at any time
from 1 January 2011 and 1 July 2011, respectively.
4 The preferred stock has been redeemable at the option of HSBC USA, Inc., in whole or in part, from 1 July 1999 at par.
5 The preferred stock has been redeemable at the option of HSBC USA, Inc., in whole or in part, from 1 October 2007 at par.
6 The Series E preferred shares are redeemable at par at the option of HSBC Bank Canada, in whole or in part commencing 30 June 2014
and on 30 June every five years thereafter.
7 The Series C and Series D preferred shares have been redeemable at a declining premium above par at the option of HSBC Bank
Canada, in whole or in part, from 30 June 2010 and 31 December 2010, respectively.