HSBC 2011 Annual Report Download - page 28
Download and view the complete annual report
Please find page 28 of the 2011 HSBC annual report below. You can navigate through the pages in the report by either clicking on the pages listed below, or by using the keyword search tool below to find specific information within the annual report.-
 1
1 -
2
-
3
-
4
-
5
-
6
-
7
-
8
-
9
-
10
-
11
-
12
-
13
-
14
-
15
-
16
-
17
-
 18
18 -
 19
19 -
 20
20 -
 21
21 -
 22
22 -
 23
23 -
 24
24 -
 25
25 -
 26
26 -
 27
27 -
 28
28 -
 29
29 -
 30
30 -
 31
31 -
 32
32 -
 33
33 -
 34
34 -
 35
35 -
 36
36 -
 37
37 -
 38
38 -
39
-
40
-
41
-
42
-
43
-
44
-
45
-
46
-
47
-
48
-
49
-
50
-
51
-
52
-
53
-
54
-
55
-
56
-
57
-
58
-
59
-
60
-
61
-
62
-
63
-
64
-
65
-
66
-
67
-
68
-
69
-
70
-
71
-
72
-
73
-
74
-
75
-
76
-
77
-
78
-
79
-
80
-
81
-
82
-
83
-
84
-
85
-
86
-
87
-
88
-
89
-
90
-
91
-
92
-
93
-
94
-
95
-
96
-
97
-
98
-
99
-
100
-
101
-
102
-
103
-
104
-
105
-
106
-
107
-
108
-
109
-
110
-
111
-
112
-
113
-
114
-
115
-
116
-
117
-
118
-
119
-
120
-
121
-
122
-
123
-
124
-
125
-
126
-
127
-
128
-
129
-
130
-
131
-
132
-
133
-
134
-
135
-
136
-
137
-
138
-
139
-
140
-
141
-
142
-
143
-
144
-
145
-
146
-
147
-
148
-
149
-
150
-
151
-
152
-
153
-
154
-
155
-
156
-
157
-
158
-
159
-
160
-
161
-
162
-
163
-
164
-
165
-
166
-
167
-
168
-
169
-
170
-
171
-
172
-
173
-
174
-
175
-
176
-
177
-
178
-
179
-
180
-
181
-
182
-
183
-
184
-
185
-
186
-
187
-
188
-
189
-
190
-
191
-
192
-
193
-
194
-
195
-
196
-
197
-
198
-
199
-
200
-
201
-
202
-
203
-
204
-
205
-
206
-
207
-
208
-
209
-
210
-
211
-
212
-
213
-
214
-
215
-
216
-
217
-
218
-
219
-
220
-
221
-
222
-
223
-
224
-
225
-
226
-
227
-
228
-
229
-
230
-
231
-
232
-
233
-
234
-
235
-
236
-
237
-
238
-
239
-
240
-
241
-
242
-
243
-
244
-
245
-
246
-
247
-
248
-
249
-
250
-
251
-
252
-
253
-
254
-
255
-
256
-
257
-
258
-
259
-
260
-
261
-
262
-
263
-
264
-
265
-
266
-
267
-
268
-
269
-
270
-
271
-
272
-
273
-
274
-
275
-
276
-
277
-
278
-
279
-
280
-
281
-
282
-
283
-
284
-
285
-
286
-
287
-
288
-
289
-
290
-
291
-
292
-
293
-
294
-
295
-
296
-
297
-
298
-
299
-
300
-
301
-
302
-
303
-
304
-
305
-
306
-
307
-
308
-
309
-
310
-
311
-
312
-
313
-
314
-
315
-
316
-
317
-
318
-
319
-
320
-
321
-
322
-
323
-
324
-
325
-
326
-
327
-
328
-
329
-
330
-
331
-
332
-
333
-
334
-
335
-
336
-
337
-
338
-
339
-
340
-
341
-
342
-
343
-
344
-
345
-
346
-
347
-
348
-
349
-
350
-
351
-
352
-
353
-
354
-
355
-
356
-
357
-
358
-
359
-
360
-
361
-
362
-
363
-
364
-
365
-
366
-
367
-
368
-
369
-
370
-
371
-
372
-
373
-
374
-
375
-
376
-
377
-
378
-
379
-
380
-
381
-
382
-
383
-
384
-
385
-
386
-
387
-
388
-
389
-
390
-
391
-
392
-
393
-
394
-
395
-
396
-
397
-
398
-
399
-
400
-
401
-
402
-
403
-
404
-
405
-
406
-
407
-
408
-
409
-
410
-
411
-
412
-
413
-
414
-
415
-
416
-
417
-
418
-
419
-
420
-
421
-
422
-
423
-
424
-
425
-
426
-
427
-
428
-
429
-
430
-
431
-
432
-
433
-
434
-
435
-
436
-
437
-
438
-
439
-
440
 |
 |

HSBC HOLDINGS PLC
Report of the Directors: Operating and Financial Review (continued)
Financial summary > Group performance
26
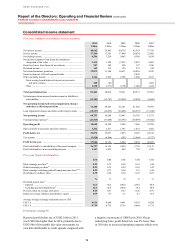
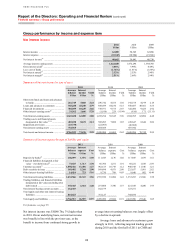
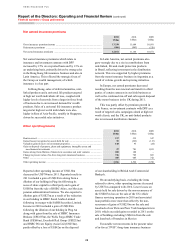
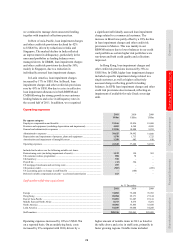
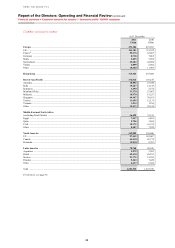
Net earned insurance premiums
2011
US$m
2010
US$m
2009
US$m
Gross insurance premium income .............................................................................. 13,338 11,609 10,991
Reinsurance premiums ............................................................................................... (466) (463) (520)
Net earned insurance premiums ................................................................................. 12,872 11,146 10,471
Net earned insurance premiums which relate to
insurance and investment contracts with DPF
increased by 15% on a reported basis and by 13% on
an underlying basis, primarily driven by strong sales
in the Hong Kong life insurance business and also in
Latin America. This reflected the strategic focus of
the Group on wealth management, of which
insurance is a key part.
In Hong Kong, sales of deferred annuities, unit-
linked products and a universal life product targeted
at high net worth individuals all rose, coupled with
higher levels of renewals from a larger in-force book
of business due to an increased demand for wealth
products. Sales of a universal life insurance product
targeted at high net worth individuals were also
higher in Rest of Asia-Pacific, notably in Singapore,
driven by successful sales initiatives.
In Latin America, net earned premiums also
grew strongly due to a rise in contributions from
unit-linked, life and credit protection products
in Brazil, reflecting investment in the distribution
network. This was supported by higher premiums
from the motor insurance business in Argentina as a
result of volume growth and repricing initiatives.
In Europe, net earned premiums decreased
resulting from the non-renewal and transfer to third
parties of certain contracts in our Irish business as
well as the continued run-off and subsequent disposal
of the motor business in the UK during 2011.
This was partly offset by premium growth in
both France, on investment contracts with DPF as a
result of targeted sales campaigns aimed at high net
worth clients, and the UK, on unit-linked products
due to increased distribution channels.
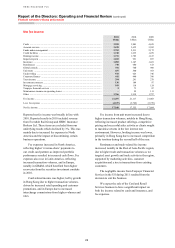
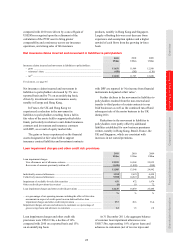
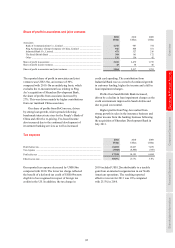
Other operating income
2011
US$m
2010
US$m
2009
US$m
Rent received .............................................................................................................. 217 535 547
Gains/(losses) recognised on assets held for sale ....................................................... 55 (263) (115)
Valuation gains/(losses) on investment properties ..................................................... 118 93 (24)
Gain on disposal of property, plant and equipment, intangible assets and
non-financial investments ...................................................................................... 57 701 1,033
Gains arising from dilution of interests in associates and joint ventures .................. 208 188 –
Change in present value of in-force long-term insurance business ........................... 726 705 605
Other ........................................................................................................................... 385 603 742
Other operating income .............................................................................................. 1,766 2,562 2,788
Reported other operating income of US$1.8bn
decreased by US$796m in 2011. Reported results in
2011 included a gain of US$181m arising from a
dilution of our holding in Ping An following its
issue of share capital to a third party and a gain of
US$83m from the sale of HSBC Afore, our Mexican
pension administration business. We also reported a
dilution gain of US$27m as a result of the reduction
in our holding in HSBC Saudi Arabia Limited
following its merger with SABB Securities Limited.
Income in 2010 included a gain of US$188m
following the dilution of our holding in Ping An
along with gains from the sale of HSBC Insurance
Brokers (US$107m), the Wells Fargo HSBC Trade
Bank (US$66m), Eversholt Rail Group (US$255m)
and HSBC Private Equity (Asia) Ltd (US$74m),
partly offset by a loss of US$42m on the disposal
of our shareholding in British Arab Commercial
Bank plc.
On an underlying basis, excluding the items
referred to above, other operating income decreased
by US$71m compared with 2010. Lower losses on
assets held for sale driven by the non-recurrence of
the US$207m loss on the sale of the US vehicle
finance servicing operation in 2010 and associated
loan portfolio were more than offset by the non-
recurrence of gains of US$250m on the sale and
leaseback of our Paris and New York headquarters in
2010, which exceeded gains recorded in 2011 on the
sale of buildings including US$61m from the sale
and leaseback of branches in Mexico.
Favourable net movements in the present value
of in-force (‘PVIF’) long-term insurance business