HSBC 2011 Annual Report Download - page 64
Download and view the complete annual report
Please find page 64 of the 2011 HSBC annual report below. You can navigate through the pages in the report by either clicking on the pages listed below, or by using the keyword search tool below to find specific information within the annual report.-
 1
1 -
2
-
3
-
4
-
5
-
6
-
7
-
8
-
9
-
10
-
11
-
12
-
13
-
14
-
15
-
16
-
17
-
18
-
19
-
20
-
21
-
22
-
23
-
24
-
25
-
26
-
27
-
28
-
29
-
30
-
31
-
32
-
33
-
34
-
35
-
36
-
37
-
38
-
39
-
40
-
41
-
42
-
43
-
44
-
45
-
46
-
47
-
48
-
49
-
50
-
51
-
52
-
53
-
 54
54 -
 55
55 -
 56
56 -
 57
57 -
 58
58 -
 59
59 -
 60
60 -
 61
61 -
 62
62 -
 63
63 -
 64
64 -
 65
65 -
 66
66 -
 67
67 -
 68
68 -
 69
69 -
 70
70 -
 71
71 -
 72
72 -
 73
73 -
 74
74 -
75
-
76
-
77
-
78
-
79
-
80
-
81
-
82
-
83
-
84
-
85
-
86
-
87
-
88
-
89
-
90
-
91
-
92
-
93
-
94
-
95
-
96
-
97
-
98
-
99
-
100
-
101
-
102
-
103
-
104
-
105
-
106
-
107
-
108
-
109
-
110
-
111
-
112
-
113
-
114
-
115
-
116
-
117
-
118
-
119
-
120
-
121
-
122
-
123
-
124
-
125
-
126
-
127
-
128
-
129
-
130
-
131
-
132
-
133
-
134
-
135
-
136
-
137
-
138
-
139
-
140
-
141
-
142
-
143
-
144
-
145
-
146
-
147
-
148
-
149
-
150
-
151
-
152
-
153
-
154
-
155
-
156
-
157
-
158
-
159
-
160
-
161
-
162
-
163
-
164
-
165
-
166
-
167
-
168
-
169
-
170
-
171
-
172
-
173
-
174
-
175
-
176
-
177
-
178
-
179
-
180
-
181
-
182
-
183
-
184
-
185
-
186
-
187
-
188
-
189
-
190
-
191
-
192
-
193
-
194
-
195
-
196
-
197
-
198
-
199
-
200
-
201
-
202
-
203
-
204
-
205
-
206
-
207
-
208
-
209
-
210
-
211
-
212
-
213
-
214
-
215
-
216
-
217
-
218
-
219
-
220
-
221
-
222
-
223
-
224
-
225
-
226
-
227
-
228
-
229
-
230
-
231
-
232
-
233
-
234
-
235
-
236
-
237
-
238
-
239
-
240
-
241
-
242
-
243
-
244
-
245
-
246
-
247
-
248
-
249
-
250
-
251
-
252
-
253
-
254
-
255
-
256
-
257
-
258
-
259
-
260
-
261
-
262
-
263
-
264
-
265
-
266
-
267
-
268
-
269
-
270
-
271
-
272
-
273
-
274
-
275
-
276
-
277
-
278
-
279
-
280
-
281
-
282
-
283
-
284
-
285
-
286
-
287
-
288
-
289
-
290
-
291
-
292
-
293
-
294
-
295
-
296
-
297
-
298
-
299
-
300
-
301
-
302
-
303
-
304
-
305
-
306
-
307
-
308
-
309
-
310
-
311
-
312
-
313
-
314
-
315
-
316
-
317
-
318
-
319
-
320
-
321
-
322
-
323
-
324
-
325
-
326
-
327
-
328
-
329
-
330
-
331
-
332
-
333
-
334
-
335
-
336
-
337
-
338
-
339
-
340
-
341
-
342
-
343
-
344
-
345
-
346
-
347
-
348
-
349
-
350
-
351
-
352
-
353
-
354
-
355
-
356
-
357
-
358
-
359
-
360
-
361
-
362
-
363
-
364
-
365
-
366
-
367
-
368
-
369
-
370
-
371
-
372
-
373
-
374
-
375
-
376
-
377
-
378
-
379
-
380
-
381
-
382
-
383
-
384
-
385
-
386
-
387
-
388
-
389
-
390
-
391
-
392
-
393
-
394
-
395
-
396
-
397
-
398
-
399
-
400
-
401
-
402
-
403
-
404
-
405
-
406
-
407
-
408
-
409
-
410
-
411
-
412
-
413
-
414
-
415
-
416
-
417
-
418
-
419
-
420
-
421
-
422
-
423
-
424
-
425
-
426
-
427
-
428
-
429
-
430
-
431
-
432
-
433
-
434
-
435
-
436
-
437
-
438
-
439
-
440
 |
 |

HSBC HOLDINGS PLC
Report of the Directors: Operating and Financial Review (continued)
Geographical regions > Europe
62
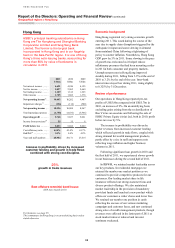
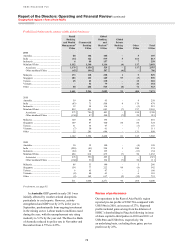
In Continental Europe, we experienced strong
demand in term lending and significant growth in
our deposit base in both RBWM and CMB,
reflecting marketing and pricing initiatives. Our
Trade and Supply Chain business performed strongly
across the region, following the launch of our export
initiative during 2011. In Europe we now have 18
countries with full renminbi functionality with the
ability to settle trade transactions via either Shanghai
or Hong Kong.
We won several awards in GB&M including
‘Best Debt House’ in Western Europe and the UK
from Euromoney Awards for Excellence in 2011.
We continued to invest in technology platforms
including Equities and Prime Services and are
therefore well positioned to capture medium-term
opportunities in the region. We also continued to
focus on cross-border initiatives to position
ourselves to take advantage of trade flows. In
Payments & Cash Management, enhanced network
capabilities together with innovative liquidity,
channel and payables solutions allowed us to win
substantial business across the corporate and
financial institution business segments.
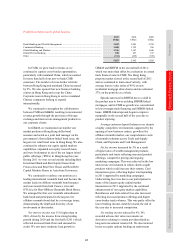
In GPB, revenue growth was driven by increased
client activity as we leveraged our global businesses’
strengths and connectivity. GPB continues to build
on its expertise in alternative investments, emerging
markets and foreign exchange.
The pace of regulatory reform is expected to gain
momentum. This will include forthcoming
legislation arising from the UK Independent
Commission on Banking which is likely to require us
to make significant changes to our corporate
structure and business activities conducted through
our UK banking subsidiary, HSBC Bank (see
page 101).
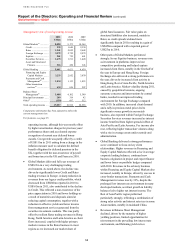
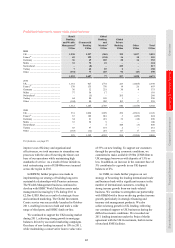
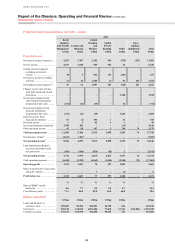
Net interest income decreased by 6%, reflecting
the decline in Balance Sheet Management revenues
as higher-yielding positions matured and
opportunities for reinvestment at similar yields were
limited by the prevailing low interest rate
environment. This was coupled with a fall in Credit
and Lending net interest income as a result of lower
balances, coupled with a decrease in effective yields
and lower asset holdings in our legacy credit
portfolio as a result of maturities and disposals
aimed at reducing capital consumption. The above
factors were partly offset by higher net interest
income in CMB, driven by an increase in term
lending balances in the UK and Continental Europe
as a result of targeted campaigns during 2010 and
2011. Net interest income also benefited from strong
mortgage balance growth in the UK along with
strong deposit growth across the region, mainly
driven by marketing campaigns, although offset in
part by strong competition for deposits resulting in
lower deposit spreads, notably in RBWM in the UK.
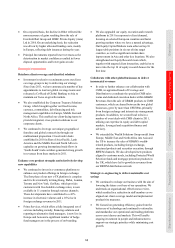
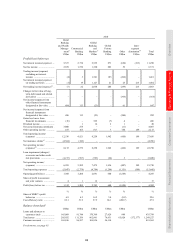
Net fee income declined by 4% as management
services income generated from the securities
investment conduits within our legacy credit
portfolio was lower, along with higher intercompany
fees payable on intra-group referrals. In addition,
overdraft fees declined due to reduced customer
appetite for debt in the current market conditions.
This was partly offset by higher levels of client
activity in GPB due to an increase in transaction
volumes related to higher market volatility.
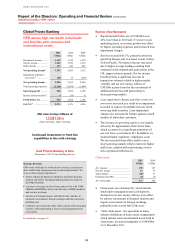
Net trading income decreased by 33%, due to
significantly lower trading revenues in Credit and
Rates as turmoil in eurozone sovereign debt markets
escalated in the second half of 2011. Increased risk
aversion and limited client activity led to a
significant widening of spreads on certain eurozone
sovereign and corporate bonds, resulting in losses
in our Credit and Rates businesses. In addition,
legacy credit revenues fell due to the non-recurrence
of the price appreciation on legacy assets in 2010.
Lower favourable foreign exchange movements
were also reported on trading assets held as
economic hedges of foreign currency debt
designated at fair value. These offset lower adverse
foreign exchange movements on the foreign
currency debt which are reported in ‘Net expense
from financial instruments designated at fair value’.
Trading income included a favourable fair value
movement of US$391m from structured liabilities,
mainly in Rates, as credit spreads widened compared
with adverse fair value movements of US$29m in
2010. In our Equities business, revenues rose as
investment in platforms improved our competitive
positioning and helped capture increased client
flows. This was coupled with lower losses on
portfolio hedges in Global Banking compared with
the previous year.
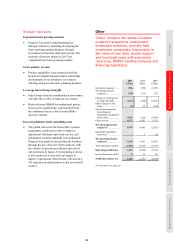
Net expense from financial instruments
designated at fair value was US$479m, reflecting
net investment losses during 2011 on assets held by
our insurance business to meet liabilities under
insurance and investment contracts as equity markets
fell, notably in the second half of 2011, compared
with gains reported in 2010. To the extent that these
losses were attributable to policyholders holding
unit-linked insurance policies and insurance or
investment contracts with DPF, there was a
corresponding decrease in ‘Net insurance claims
incurred and movement in liabilities to
policyholders’. These losses were partly offset by