HSBC 2011 Annual Report Download - page 335
Download and view the complete annual report
Please find page 335 of the 2011 HSBC annual report below. You can navigate through the pages in the report by either clicking on the pages listed below, or by using the keyword search tool below to find specific information within the annual report.-
 1
1 -
2
-
3
-
4
-
5
-
6
-
7
-
8
-
9
-
10
-
11
-
12
-
13
-
14
-
15
-
16
-
17
-
18
-
19
-
20
-
21
-
22
-
23
-
24
-
25
-
26
-
27
-
28
-
29
-
30
-
31
-
32
-
33
-
34
-
35
-
36
-
37
-
38
-
39
-
40
-
41
-
42
-
43
-
44
-
45
-
46
-
47
-
48
-
49
-
50
-
51
-
52
-
53
-
54
-
55
-
56
-
57
-
58
-
59
-
60
-
61
-
62
-
63
-
64
-
65
-
66
-
67
-
68
-
69
-
70
-
71
-
72
-
73
-
74
-
75
-
76
-
77
-
78
-
79
-
80
-
81
-
82
-
83
-
84
-
85
-
86
-
87
-
88
-
89
-
90
-
91
-
92
-
93
-
94
-
95
-
96
-
97
-
98
-
99
-
100
-
101
-
102
-
103
-
104
-
105
-
106
-
107
-
108
-
109
-
110
-
111
-
112
-
113
-
114
-
115
-
116
-
117
-
118
-
119
-
120
-
121
-
122
-
123
-
124
-
125
-
126
-
127
-
128
-
129
-
130
-
131
-
132
-
133
-
134
-
135
-
136
-
137
-
138
-
139
-
140
-
141
-
142
-
143
-
144
-
145
-
146
-
147
-
148
-
149
-
150
-
151
-
152
-
153
-
154
-
155
-
156
-
157
-
158
-
159
-
160
-
161
-
162
-
163
-
164
-
165
-
166
-
167
-
168
-
169
-
170
-
171
-
172
-
173
-
174
-
175
-
176
-
177
-
178
-
179
-
180
-
181
-
182
-
183
-
184
-
185
-
186
-
187
-
188
-
189
-
190
-
191
-
192
-
193
-
194
-
195
-
196
-
197
-
198
-
199
-
200
-
201
-
202
-
203
-
204
-
205
-
206
-
207
-
208
-
209
-
210
-
211
-
212
-
213
-
214
-
215
-
216
-
217
-
218
-
219
-
220
-
221
-
222
-
223
-
224
-
225
-
226
-
227
-
228
-
229
-
230
-
231
-
232
-
233
-
234
-
235
-
236
-
237
-
238
-
239
-
240
-
241
-
242
-
243
-
244
-
245
-
246
-
247
-
248
-
249
-
250
-
251
-
252
-
253
-
254
-
255
-
256
-
257
-
258
-
259
-
260
-
261
-
262
-
263
-
264
-
265
-
266
-
267
-
268
-
269
-
270
-
271
-
272
-
273
-
274
-
275
-
276
-
277
-
278
-
279
-
280
-
281
-
282
-
283
-
284
-
285
-
286
-
287
-
288
-
289
-
290
-
291
-
292
-
293
-
294
-
295
-
296
-
297
-
298
-
299
-
300
-
301
-
302
-
303
-
304
-
305
-
306
-
307
-
308
-
309
-
310
-
311
-
312
-
313
-
314
-
315
-
316
-
317
-
318
-
319
-
320
-
321
-
322
-
323
-
324
-
 325
325 -
 326
326 -
 327
327 -
 328
328 -
 329
329 -
 330
330 -
 331
331 -
 332
332 -
 333
333 -
 334
334 -
 335
335 -
 336
336 -
 337
337 -
 338
338 -
 339
339 -
 340
340 -
 341
341 -
 342
342 -
 343
343 -
 344
344 -
 345
345 -
346
-
347
-
348
-
349
-
350
-
351
-
352
-
353
-
354
-
355
-
356
-
357
-
358
-
359
-
360
-
361
-
362
-
363
-
364
-
365
-
366
-
367
-
368
-
369
-
370
-
371
-
372
-
373
-
374
-
375
-
376
-
377
-
378
-
379
-
380
-
381
-
382
-
383
-
384
-
385
-
386
-
387
-
388
-
389
-
390
-
391
-
392
-
393
-
394
-
395
-
396
-
397
-
398
-
399
-
400
-
401
-
402
-
403
-
404
-
405
-
406
-
407
-
408
-
409
-
410
-
411
-
412
-
413
-
414
-
415
-
416
-
417
-
418
-
419
-
420
-
421
-
422
-
423
-
424
-
425
-
426
-
427
-
428
-
429
-
430
-
431
-
432
-
433
-
434
-
435
-
436
-
437
-
438
-
439
-
440
 |
 |

333
Overview Operating & Financial Review Corporate Governance Financial Statements Shareholder Information
US
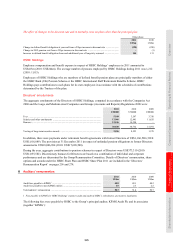
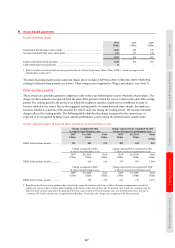
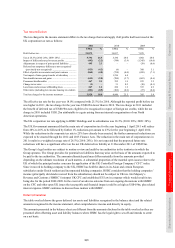
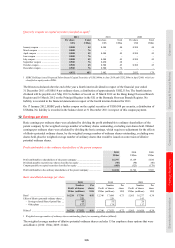
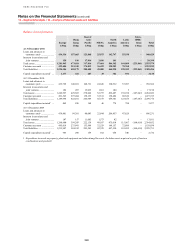
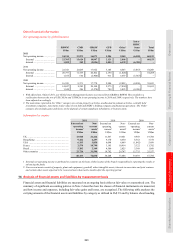
Of the total net deferred tax assets of US$6.2bn at 31 December 2011 (2010: US$5.9bn), the net deferred tax asset
relating to HSBC’s operations in the US is US$5.2bn (2010: US$4.0bn). The deferred tax assets included in this total
reflect the carry forward of tax losses and tax credits (US$1.2bn; 2010: US$0.2bn), deductible temporary differences
in respect of loan impairment allowances (US$2.7bn; 2010: US$3.0bn) and other temporary differences (US$1.3bn;
2010: US$0.8bn).
Deductions for loan impairments for US tax purposes generally occur when the impaired loan is charged off, often in
the period subsequent to that in which the impairment is recognised for accounting purposes. As a result, the amount
of the associated deferred tax asset should generally move in line with the impairment allowance balance. On the
evidence available, including historical levels of profitability, management projections of future income and HSBC
Holdings’ commitment to continue to invest sufficient capital in North America to recover the deferred tax asset, it is
expected there will be sufficient taxable income generated by the business to realise these assets. Management
projections of profits from the US operations are prepared for a 10 year period and include assumptions about future
house prices and US economic conditions, including unemployment levels. The proposed sale of both the Group’s
US credit card and private label credit card business and upstate New York branches announced in the second half of
2011 has been taken into account but even if the transactions failed to complete, this would not change management’s
view that the business will generate sufficient profits to realise these assets.
Management projections of profits from the US operations currently indicate that the existing carry forward tax
losses and tax credits will be fully recovered by 2014. The current level of the deferred tax asset in respect of loan
impairment allowances is projected to reduce over the 10 year period in line with the reduction of the Consumer
Lending portfolio.
As there has been a recent history of losses in HSBC’s US operations, management’s analysis of the recognition of
these deferred tax assets significantly discounts any future expected profits from the US operations and relies to a
greater extent on capital support from HSBC Holdings, including tax planning strategies implemented in relation to
such support. The principal strategy is the retention of capital in the US in excess of normal regulatory requirements.
Brazil
The net deferred tax asset relating to HSBC’s operations in Brazil is US$0.7bn (2010: US$0.8bn). The deferred tax
assets included in this total arise primarily in relation to deductible temporary differences in respect of loan
impairment allowances. Deductions for loan impairments for Brazilian tax purposes generally occur in periods
subsequent to those in which they are recognised for accounting purposes and, as a result, the amount of the
associated deferred tax assets will move in line with the impairment allowance balance.
Loan impairment deductions are recognised for tax purposes typically within 24 months of accounting recognition.
On the evidence available, including historic levels of profitability, management projections of income and the state
of the Brazilian economy, it is anticipated there will be sufficient taxable income generated by the business to realise
these assets when deductible for tax purposes.
There are no material carried forward tax losses or tax credits recognised within the Group’s deferred tax assets in
Brazil.
Mexico
The net deferred tax asset relating to HSBC’s operations in Mexico is US$0.5bn (2010: US$0.6bn). The deferred tax
assets included in this total relate primarily to deductible temporary differences in respect of accounting provisions
for impaired loans, including losses realised on sales of impaired loans. The annual deduction for loan impairments is
capped under Mexican legislation at 2.5% of the average qualifying loan portfolio. The balance is carried forward to
future years without expiry but with annual deduction subject to the 2.5% cap.
On the evidence available, including historic and projected levels of loan portfolio growth, loan impairment rates and
profitability, it is anticipated that the business will realise these assets within the next 15 years. The projections
assume that loan impairment rates will, over the medium term, return to and remain at levels consistently below the
annual 2.5% cap.
There are no material carried forward tax losses or tax credits recognised within the Group’s deferred tax assets in
Mexico.