HSBC 2011 Annual Report Download - page 182
Download and view the complete annual report
Please find page 182 of the 2011 HSBC annual report below. You can navigate through the pages in the report by either clicking on the pages listed below, or by using the keyword search tool below to find specific information within the annual report.-
 1
1 -
2
-
3
-
4
-
5
-
6
-
7
-
8
-
9
-
10
-
11
-
12
-
13
-
14
-
15
-
16
-
17
-
18
-
19
-
20
-
21
-
22
-
23
-
24
-
25
-
26
-
27
-
28
-
29
-
30
-
31
-
32
-
33
-
34
-
35
-
36
-
37
-
38
-
39
-
40
-
41
-
42
-
43
-
44
-
45
-
46
-
47
-
48
-
49
-
50
-
51
-
52
-
53
-
54
-
55
-
56
-
57
-
58
-
59
-
60
-
61
-
62
-
63
-
64
-
65
-
66
-
67
-
68
-
69
-
70
-
71
-
72
-
73
-
74
-
75
-
76
-
77
-
78
-
79
-
80
-
81
-
82
-
83
-
84
-
85
-
86
-
87
-
88
-
89
-
90
-
91
-
92
-
93
-
94
-
95
-
96
-
97
-
98
-
99
-
100
-
101
-
102
-
103
-
104
-
105
-
106
-
107
-
108
-
109
-
110
-
111
-
112
-
113
-
114
-
115
-
116
-
117
-
118
-
119
-
120
-
121
-
122
-
123
-
124
-
125
-
126
-
127
-
128
-
129
-
130
-
131
-
132
-
133
-
134
-
135
-
136
-
137
-
138
-
139
-
140
-
141
-
142
-
143
-
144
-
145
-
146
-
147
-
148
-
149
-
150
-
151
-
152
-
153
-
154
-
155
-
156
-
157
-
158
-
159
-
160
-
161
-
162
-
163
-
164
-
165
-
166
-
167
-
168
-
169
-
170
-
171
-
 172
172 -
 173
173 -
 174
174 -
 175
175 -
 176
176 -
 177
177 -
 178
178 -
 179
179 -
 180
180 -
 181
181 -
 182
182 -
 183
183 -
 184
184 -
 185
185 -
 186
186 -
 187
187 -
 188
188 -
 189
189 -
 190
190 -
 191
191 -
 192
192 -
193
-
194
-
195
-
196
-
197
-
198
-
199
-
200
-
201
-
202
-
203
-
204
-
205
-
206
-
207
-
208
-
209
-
210
-
211
-
212
-
213
-
214
-
215
-
216
-
217
-
218
-
219
-
220
-
221
-
222
-
223
-
224
-
225
-
226
-
227
-
228
-
229
-
230
-
231
-
232
-
233
-
234
-
235
-
236
-
237
-
238
-
239
-
240
-
241
-
242
-
243
-
244
-
245
-
246
-
247
-
248
-
249
-
250
-
251
-
252
-
253
-
254
-
255
-
256
-
257
-
258
-
259
-
260
-
261
-
262
-
263
-
264
-
265
-
266
-
267
-
268
-
269
-
270
-
271
-
272
-
273
-
274
-
275
-
276
-
277
-
278
-
279
-
280
-
281
-
282
-
283
-
284
-
285
-
286
-
287
-
288
-
289
-
290
-
291
-
292
-
293
-
294
-
295
-
296
-
297
-
298
-
299
-
300
-
301
-
302
-
303
-
304
-
305
-
306
-
307
-
308
-
309
-
310
-
311
-
312
-
313
-
314
-
315
-
316
-
317
-
318
-
319
-
320
-
321
-
322
-
323
-
324
-
325
-
326
-
327
-
328
-
329
-
330
-
331
-
332
-
333
-
334
-
335
-
336
-
337
-
338
-
339
-
340
-
341
-
342
-
343
-
344
-
345
-
346
-
347
-
348
-
349
-
350
-
351
-
352
-
353
-
354
-
355
-
356
-
357
-
358
-
359
-
360
-
361
-
362
-
363
-
364
-
365
-
366
-
367
-
368
-
369
-
370
-
371
-
372
-
373
-
374
-
375
-
376
-
377
-
378
-
379
-
380
-
381
-
382
-
383
-
384
-
385
-
386
-
387
-
388
-
389
-
390
-
391
-
392
-
393
-
394
-
395
-
396
-
397
-
398
-
399
-
400
-
401
-
402
-
403
-
404
-
405
-
406
-
407
-
408
-
409
-
410
-
411
-
412
-
413
-
414
-
415
-
416
-
417
-
418
-
419
-
420
-
421
-
422
-
423
-
424
-
425
-
426
-
427
-
428
-
429
-
430
-
431
-
432
-
433
-
434
-
435
-
436
-
437
-
438
-
439
-
440
 |
 |

HSBC HOLDINGS PLC
Report of the Directors: Operating and Financial Review (continued)
Risk > Insurance risk > Financial risks / PVIF
180
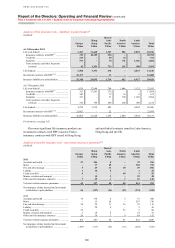
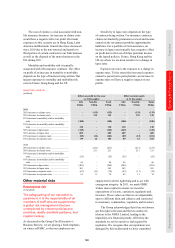
Reinsurers’ share of liabilities under insurance contracts (continued)
Neither past due nor impaired Past due
Strong Good
Satisfactory
Sub-
standard
but not
impaired
Total
US$m US$m US$m US$m US$m US$m
At 31 December 2010
Linked insurance contracts ................................. 44 716 – – – 760
Non-linked insurance contracts .......................... 997 11 76 12 9 1,105
Total73 ................................................................. 1,041 727 76 12 9 1,865
Reinsurance debtors ............................................ 30 8 30 1 10 79
For footnote, see page 185.
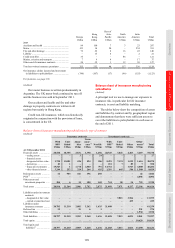
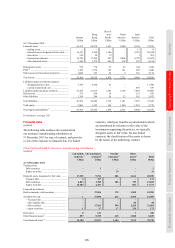
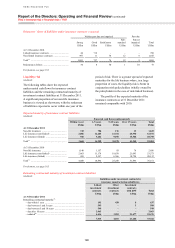
Liquidity risk
(Audited)
The following tables show the expected
undiscounted cash flows for insurance contract
liabilities and the remaining contractual maturity of
investment contract liabilities at 31 December 2011.
A significant proportion of our non-life insurance
business is viewed as short-term, with the settlement
of liabilities expected to occur within one year of the
period of risk. There is a greater spread of expected
maturities for the life business where, in a large
proportion of cases, the liquidity risk is borne in
conjunction with policyholders (wholly owned by
the policyholder in the case of unit-linked business).
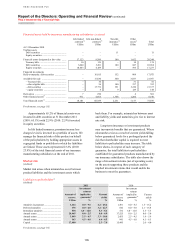
The profile of the expected maturity of the
insurance contracts as at 31 December 2011
remained comparable with 2010.
Expected maturity of insurance contract liabilities
(Audited)
Expected cash flows (undiscounted)
Within 1 year 1-5 years 5-15 years Over 15 years Total
US$m US$m US$m US$m US$m
At 31 December 2011
Non-life insurance .......................................... 742 704 176 13 1,635
Life insurance (non-linked) ............................ 2,006 12,243 21,332 25,990 61,571
Life insurance (linked) ................................... 920 3,262 9,070 15,546 28,798
Total73 ............................................................. 3,668 16,209 30,578 41,549 92,004
At 31 December 2010
Non-life insurance .......................................... 1,140 1,157 83 76 2,456
Life insurance (non-linked) ............................ 2,463 11,178 18,839 21,093 53,573
Life insurance (linked) ................................... 485 2,557 6,366 10,724 20,132
Total73 ............................................................. 4,088 14,892 25,288 31,893 76,161
For footnote, see page 185.
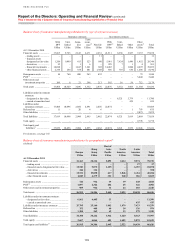
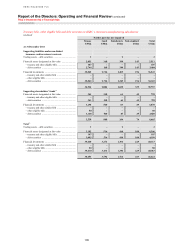
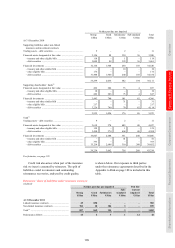
Remaining contractual maturity of investment contract liabilities
(Audited)
Liabilities under investment contracts by
insurance manufacturing subsidiaries
Linked
investment
contracts
Other
investment
contracts
Investment
contracts
with DPF
Total
US$m US$m US$m US$m
At 31 December 2011
Remaining contractual maturity:73
– due within 1 year ................................................................... 191 438 8 637
– due between 1 and 5 years .................................................... 595 – 3 598
– due between 5 and 10 years .................................................. 548 – – 548
– due after 10 years .................................................................. 2,063 – – 2,063
– undated80 ................................................................................ 4,416 3,583 21,477 29,476
7,813 4,021 21,488 33,322