HSBC 2011 Annual Report Download - page 394
Download and view the complete annual report
Please find page 394 of the 2011 HSBC annual report below. You can navigate through the pages in the report by either clicking on the pages listed below, or by using the keyword search tool below to find specific information within the annual report.-
 1
1 -
2
-
3
-
4
-
5
-
6
-
7
-
8
-
9
-
10
-
11
-
12
-
13
-
14
-
15
-
16
-
17
-
18
-
19
-
20
-
21
-
22
-
23
-
24
-
25
-
26
-
27
-
28
-
29
-
30
-
31
-
32
-
33
-
34
-
35
-
36
-
37
-
38
-
39
-
40
-
41
-
42
-
43
-
44
-
45
-
46
-
47
-
48
-
49
-
50
-
51
-
52
-
53
-
54
-
55
-
56
-
57
-
58
-
59
-
60
-
61
-
62
-
63
-
64
-
65
-
66
-
67
-
68
-
69
-
70
-
71
-
72
-
73
-
74
-
75
-
76
-
77
-
78
-
79
-
80
-
81
-
82
-
83
-
84
-
85
-
86
-
87
-
88
-
89
-
90
-
91
-
92
-
93
-
94
-
95
-
96
-
97
-
98
-
99
-
100
-
101
-
102
-
103
-
104
-
105
-
106
-
107
-
108
-
109
-
110
-
111
-
112
-
113
-
114
-
115
-
116
-
117
-
118
-
119
-
120
-
121
-
122
-
123
-
124
-
125
-
126
-
127
-
128
-
129
-
130
-
131
-
132
-
133
-
134
-
135
-
136
-
137
-
138
-
139
-
140
-
141
-
142
-
143
-
144
-
145
-
146
-
147
-
148
-
149
-
150
-
151
-
152
-
153
-
154
-
155
-
156
-
157
-
158
-
159
-
160
-
161
-
162
-
163
-
164
-
165
-
166
-
167
-
168
-
169
-
170
-
171
-
172
-
173
-
174
-
175
-
176
-
177
-
178
-
179
-
180
-
181
-
182
-
183
-
184
-
185
-
186
-
187
-
188
-
189
-
190
-
191
-
192
-
193
-
194
-
195
-
196
-
197
-
198
-
199
-
200
-
201
-
202
-
203
-
204
-
205
-
206
-
207
-
208
-
209
-
210
-
211
-
212
-
213
-
214
-
215
-
216
-
217
-
218
-
219
-
220
-
221
-
222
-
223
-
224
-
225
-
226
-
227
-
228
-
229
-
230
-
231
-
232
-
233
-
234
-
235
-
236
-
237
-
238
-
239
-
240
-
241
-
242
-
243
-
244
-
245
-
246
-
247
-
248
-
249
-
250
-
251
-
252
-
253
-
254
-
255
-
256
-
257
-
258
-
259
-
260
-
261
-
262
-
263
-
264
-
265
-
266
-
267
-
268
-
269
-
270
-
271
-
272
-
273
-
274
-
275
-
276
-
277
-
278
-
279
-
280
-
281
-
282
-
283
-
284
-
285
-
286
-
287
-
288
-
289
-
290
-
291
-
292
-
293
-
294
-
295
-
296
-
297
-
298
-
299
-
300
-
301
-
302
-
303
-
304
-
305
-
306
-
307
-
308
-
309
-
310
-
311
-
312
-
313
-
314
-
315
-
316
-
317
-
318
-
319
-
320
-
321
-
322
-
323
-
324
-
325
-
326
-
327
-
328
-
329
-
330
-
331
-
332
-
333
-
334
-
335
-
336
-
337
-
338
-
339
-
340
-
341
-
342
-
343
-
344
-
345
-
346
-
347
-
348
-
349
-
350
-
351
-
352
-
353
-
354
-
355
-
356
-
357
-
358
-
359
-
360
-
361
-
362
-
363
-
364
-
365
-
366
-
367
-
368
-
369
-
370
-
371
-
372
-
373
-
374
-
375
-
376
-
377
-
378
-
379
-
380
-
381
-
382
-
383
-
 384
384 -
 385
385 -
 386
386 -
 387
387 -
 388
388 -
 389
389 -
 390
390 -
 391
391 -
 392
392 -
 393
393 -
 394
394 -
 395
395 -
 396
396 -
 397
397 -
 398
398 -
 399
399 -
 400
400 -
 401
401 -
 402
402 -
 403
403 -
 404
404 -
405
-
406
-
407
-
408
-
409
-
410
-
411
-
412
-
413
-
414
-
415
-
416
-
417
-
418
-
419
-
420
-
421
-
422
-
423
-
424
-
425
-
426
-
427
-
428
-
429
-
430
-
431
-
432
-
433
-
434
-
435
-
436
-
437
-
438
-
439
-
440
 |
 |

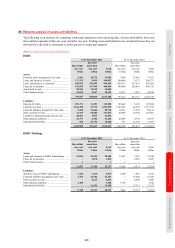
HSBC HOLDINGS PLC
Notes on the Financial Statements (continued)
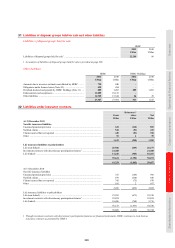
36 – Foreign exchange exposures / 37 – Assets charged as security for liabilities / 38 – Non-controlling interests
392
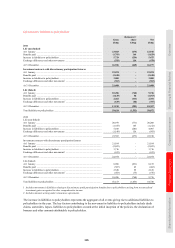
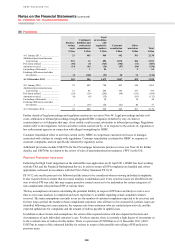
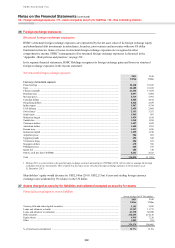
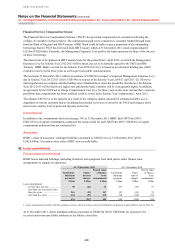
36 Foreign exchange exposures
Structural foreign exchange exposures
HSBC’s structural foreign exchange exposures are represented by the net asset value of its foreign exchange equity
and subordinated debt investments in subsidiaries, branches, joint ventures and associates with non-US dollar
functional currencies. Gains or losses on structural foreign exchange exposures are recognised in other
comprehensive income. HSBC’s management of its structural foreign exchange exposures is discussed in the
‘Appendix - Risk policies and practices’ on page 201.
In its separate financial statements, HSBC Holdings recognises its foreign exchange gains and losses on structural
foreign exchange exposures in the income statement.
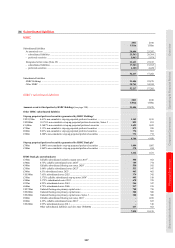
Net structural foreign exchange exposures
2011 2010
US$m US$m
Currency of structural exposure
Pound sterling ........................................................................................................................................... 22,668 23,247
Euro ........................................................................................................................................................... 22,400 23,222
Chinese renminbi ...................................................................................................................................... 21,234 17,454
Brazilian reais ........................................................................................................................................... 6,097 6,004
Mexican pesos .......................................................................................................................................... 5,319 5,991
Canadian dollars ....................................................................................................................................... 4,848 4,012
Hong Kong dollars ................................................................................................................................... 4,828 2,659
Indian rupees ............................................................................................................................................. 3,967 4,754
UAE dirhams ............................................................................................................................................ 2,650 2,469
Swiss francs1 ............................................................................................................................................. 2,133 3,357
Saudi riyals ............................................................................................................................................... 1,965 907
Malaysian ringgit ...................................................................................................................................... 1,829 1,619
Turkish lira ................................................................................................................................................ 1,565 1,854
Taiwanese dollars ..................................................................................................................................... 1,457 1,429
Australian dollars ...................................................................................................................................... 1,455 1,381
Korean won ............................................................................................................................................... 1,411 1,456
Indonesian rupiah ..................................................................................................................................... 1,235 1,190
Argentine pesos ........................................................................................................................................ 984 881
Egyptian pounds ....................................................................................................................................... 692 642
Vietnamese dong ...................................................................................................................................... 686 621
Singapore dollars ...................................................................................................................................... 670 596
Philippine pesos ........................................................................................................................................ 663 635
Qatari rial .................................................................................................................................................. 608 510
Others, each less than US$500m .............................................................................................................. 4,651 4,413
Total .......................................................................................................................................................... 116,015 111,303
1 During 2011, we entered into a forward foreign exchange contract amounting to US$700m (2010: nil) in order to manage the foreign
exchange risk of our investments. This resulted in a decrease of our structural foreign exchange exposure to Swiss francs as at
31 December 2011.
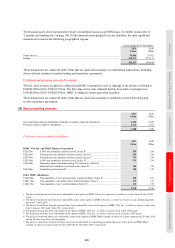
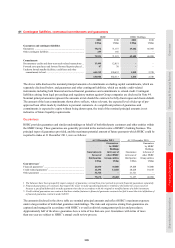
Shareholders’ equity would decrease by US$2,146m (2010: US$2,213m) if euro and sterling foreign currency
exchange rates weakened by 5% relative to the US dollar.
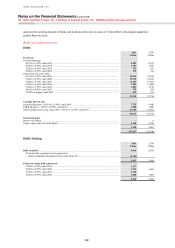
37 Assets charged as security for liabilities and collateral accepted as security for assets
Financial assets pledged to secure liabilities
Assets pledged at 31 December
2011 2010
US$m US$m
Treasury bills and other eligible securities ............................................................................................... 5,185 5,859
Loans and advances to banks ................................................................................................................... 19,247 11,773
Loans and advances to customers ............................................................................................................ 81,570 60,500
Debt securities .......................................................................................................................................... 210,255 214,126
Equity shares ............................................................................................................................................. 6,916 7,216
Other ......................................................................................................................................................... 1,003 931
324,176 300,405
% of total assets encumbered ................................................................................................................... 12.7% 12.2%