HSBC 2011 Annual Report Download - page 178
Download and view the complete annual report
Please find page 178 of the 2011 HSBC annual report below. You can navigate through the pages in the report by either clicking on the pages listed below, or by using the keyword search tool below to find specific information within the annual report.-
 1
1 -
2
-
3
-
4
-
5
-
6
-
7
-
8
-
9
-
10
-
11
-
12
-
13
-
14
-
15
-
16
-
17
-
18
-
19
-
20
-
21
-
22
-
23
-
24
-
25
-
26
-
27
-
28
-
29
-
30
-
31
-
32
-
33
-
34
-
35
-
36
-
37
-
38
-
39
-
40
-
41
-
42
-
43
-
44
-
45
-
46
-
47
-
48
-
49
-
50
-
51
-
52
-
53
-
54
-
55
-
56
-
57
-
58
-
59
-
60
-
61
-
62
-
63
-
64
-
65
-
66
-
67
-
68
-
69
-
70
-
71
-
72
-
73
-
74
-
75
-
76
-
77
-
78
-
79
-
80
-
81
-
82
-
83
-
84
-
85
-
86
-
87
-
88
-
89
-
90
-
91
-
92
-
93
-
94
-
95
-
96
-
97
-
98
-
99
-
100
-
101
-
102
-
103
-
104
-
105
-
106
-
107
-
108
-
109
-
110
-
111
-
112
-
113
-
114
-
115
-
116
-
117
-
118
-
119
-
120
-
121
-
122
-
123
-
124
-
125
-
126
-
127
-
128
-
129
-
130
-
131
-
132
-
133
-
134
-
135
-
136
-
137
-
138
-
139
-
140
-
141
-
142
-
143
-
144
-
145
-
146
-
147
-
148
-
149
-
150
-
151
-
152
-
153
-
154
-
155
-
156
-
157
-
158
-
159
-
160
-
161
-
162
-
163
-
164
-
165
-
166
-
167
-
 168
168 -
 169
169 -
 170
170 -
 171
171 -
 172
172 -
 173
173 -
 174
174 -
 175
175 -
 176
176 -
 177
177 -
 178
178 -
 179
179 -
 180
180 -
 181
181 -
 182
182 -
 183
183 -
 184
184 -
 185
185 -
 186
186 -
 187
187 -
 188
188 -
189
-
190
-
191
-
192
-
193
-
194
-
195
-
196
-
197
-
198
-
199
-
200
-
201
-
202
-
203
-
204
-
205
-
206
-
207
-
208
-
209
-
210
-
211
-
212
-
213
-
214
-
215
-
216
-
217
-
218
-
219
-
220
-
221
-
222
-
223
-
224
-
225
-
226
-
227
-
228
-
229
-
230
-
231
-
232
-
233
-
234
-
235
-
236
-
237
-
238
-
239
-
240
-
241
-
242
-
243
-
244
-
245
-
246
-
247
-
248
-
249
-
250
-
251
-
252
-
253
-
254
-
255
-
256
-
257
-
258
-
259
-
260
-
261
-
262
-
263
-
264
-
265
-
266
-
267
-
268
-
269
-
270
-
271
-
272
-
273
-
274
-
275
-
276
-
277
-
278
-
279
-
280
-
281
-
282
-
283
-
284
-
285
-
286
-
287
-
288
-
289
-
290
-
291
-
292
-
293
-
294
-
295
-
296
-
297
-
298
-
299
-
300
-
301
-
302
-
303
-
304
-
305
-
306
-
307
-
308
-
309
-
310
-
311
-
312
-
313
-
314
-
315
-
316
-
317
-
318
-
319
-
320
-
321
-
322
-
323
-
324
-
325
-
326
-
327
-
328
-
329
-
330
-
331
-
332
-
333
-
334
-
335
-
336
-
337
-
338
-
339
-
340
-
341
-
342
-
343
-
344
-
345
-
346
-
347
-
348
-
349
-
350
-
351
-
352
-
353
-
354
-
355
-
356
-
357
-
358
-
359
-
360
-
361
-
362
-
363
-
364
-
365
-
366
-
367
-
368
-
369
-
370
-
371
-
372
-
373
-
374
-
375
-
376
-
377
-
378
-
379
-
380
-
381
-
382
-
383
-
384
-
385
-
386
-
387
-
388
-
389
-
390
-
391
-
392
-
393
-
394
-
395
-
396
-
397
-
398
-
399
-
400
-
401
-
402
-
403
-
404
-
405
-
406
-
407
-
408
-
409
-
410
-
411
-
412
-
413
-
414
-
415
-
416
-
417
-
418
-
419
-
420
-
421
-
422
-
423
-
424
-
425
-
426
-
427
-
428
-
429
-
430
-
431
-
432
-
433
-
434
-
435
-
436
-
437
-
438
-
439
-
440
 |
 |

HSBC HOLDINGS PLC
Report of the Directors: Operating and Financial Review (continued)
Risk > Insurance risk > Financial risks
176
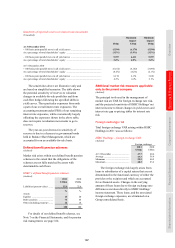
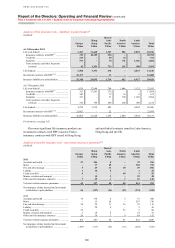
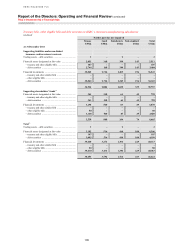
Financial assets held by insurance manufacturing subsidiaries (continued)
Life linked Life non-linked Non-life Other
contracts74 contracts75 insurance76 assets71 Total
US$m US$m US$m US$m US$m
At 31 December 2010
Trading assets
Debt securities ............................................ – – 11 – 11
Equity securities ......................................... – – – – –
Financial assets designated at fair value ........ 17,123 9,589 180 1,452 28,344
Treasury bills .............................................. 10 119 – 10 139
Debt securities ............................................ 6,660 3,281 180 847 10,968
Equity securities ......................................... 10,453 6,189 – 595 17,237
Financial investments
Held-to-maturity: debt securities .................... – 16,015 152 908 17,075
Available-for-sale: .......................................... – 17,830 540 3,587 21,957
– Treasury bills ........................................... – 10 – 31 41
– other eligible bills .................................... – 36 140 217 393
– debt securities .......................................... – 17,776 391 3,210 21,377
– equity securities ....................................... – 8 9 129 146
Derivatives ...................................................... 7 290 – 4 301
Other financial assets77 ................................... 971 4,665 1,348 1,206 8,190
Total financial assets73 .................................... 18,101 48,389 2,231 7,157 75,878
For footnotes, see page 185.
Approximately 65.2% of financial assets were
invested in debt securities at 31 December 2011
(2010: 65.1%) with 22.9% (2010: 22.9%) invested
in equity securities.
In life linked insurance, premium income less
charges levied is invested in a portfolio of assets. We
manage the financial risks of this product on behalf
of the policyholders by holding appropriate assets in
segregated funds or portfolios to which the liabilities
are linked. These assets represented 23.2% (2010:
23.9%) of the total financial assets of our insurance
manufacturing subsidiaries at the end of 2011.
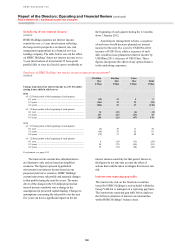
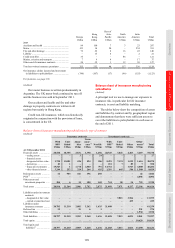
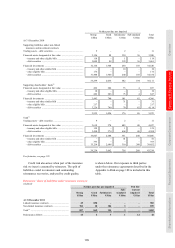
Market risk
(Audited)
Market risk arises when mismatches occur between
product liabilities and the investment assets which
back them. For example, mismatches between asset
and liability yields and maturities give rise to interest
rate risk.
Long-term insurance or investment products
may incorporate benefits that are guaranteed. Where
mismatches exist as a result of current yields falling
below guaranteed levels for a prolonged period the
risk that shareholder capital is required to meet
liabilities to policyholders may increase. The table
below shows, in respect of each category of
guarantee, the total liabilities to policyholders
established for guaranteed products manufactured by
our insurance subsidiaries. The table also shows the
range of investment returns (net of operating costs)
on the assets supporting these products and the
implied investment returns that would enable the
business to meet the guarantees.
Liabilities to policyholders78
(Audited)
2011 2010
Amount of
reserve
Investment
returns
implied by
guarantee73
Current
yields
Amount of
reserve
Investment
returns
implied by
guarantee73
Current
yields
US$m % % US$m % %
Annuities in payment ............................. 1,414 0.0 – 9.6 4.2 – 25.2 1,491
0.0 – 8.5 1.5 – 16.2
Deferred annuities ................................. 175 0.0 – 6.0 3.2 – 22.7 642
0.0 – 6.0 2.1 – 16.8
Immediate annuities ............................... 538 6.0 – 12.0 5.3 – 5.4 532
6.0 – 12.0 5.5 – 5.5
Annual return ......................................... 20,465 0.0 – 2.5 0.0 – 6.9 17,525
0.0 – 2.5 0.0 – 5.0
Annual return ......................................... 3,849 2.5 – 4.5 3.3 – 10.0 2,455
2.5 – 4.5 1.8 – 5.9
Annual return ......................................... 163 4.5 – 6.0 6.4 – 6.5 841
4.5 – 6.0 6.1 – 8.5
Capital .................................................... 17,400 – 2.3 – 7.8 15,445
–
2.0 – 4.0
For footnotes, see page 185.