HSBC 2011 Annual Report Download - page 265
Download and view the complete annual report
Please find page 265 of the 2011 HSBC annual report below. You can navigate through the pages in the report by either clicking on the pages listed below, or by using the keyword search tool below to find specific information within the annual report.-
 1
1 -
2
-
3
-
4
-
5
-
6
-
7
-
8
-
9
-
10
-
11
-
12
-
13
-
14
-
15
-
16
-
17
-
18
-
19
-
20
-
21
-
22
-
23
-
24
-
25
-
26
-
27
-
28
-
29
-
30
-
31
-
32
-
33
-
34
-
35
-
36
-
37
-
38
-
39
-
40
-
41
-
42
-
43
-
44
-
45
-
46
-
47
-
48
-
49
-
50
-
51
-
52
-
53
-
54
-
55
-
56
-
57
-
58
-
59
-
60
-
61
-
62
-
63
-
64
-
65
-
66
-
67
-
68
-
69
-
70
-
71
-
72
-
73
-
74
-
75
-
76
-
77
-
78
-
79
-
80
-
81
-
82
-
83
-
84
-
85
-
86
-
87
-
88
-
89
-
90
-
91
-
92
-
93
-
94
-
95
-
96
-
97
-
98
-
99
-
100
-
101
-
102
-
103
-
104
-
105
-
106
-
107
-
108
-
109
-
110
-
111
-
112
-
113
-
114
-
115
-
116
-
117
-
118
-
119
-
120
-
121
-
122
-
123
-
124
-
125
-
126
-
127
-
128
-
129
-
130
-
131
-
132
-
133
-
134
-
135
-
136
-
137
-
138
-
139
-
140
-
141
-
142
-
143
-
144
-
145
-
146
-
147
-
148
-
149
-
150
-
151
-
152
-
153
-
154
-
155
-
156
-
157
-
158
-
159
-
160
-
161
-
162
-
163
-
164
-
165
-
166
-
167
-
168
-
169
-
170
-
171
-
172
-
173
-
174
-
175
-
176
-
177
-
178
-
179
-
180
-
181
-
182
-
183
-
184
-
185
-
186
-
187
-
188
-
189
-
190
-
191
-
192
-
193
-
194
-
195
-
196
-
197
-
198
-
199
-
200
-
201
-
202
-
203
-
204
-
205
-
206
-
207
-
208
-
209
-
210
-
211
-
212
-
213
-
214
-
215
-
216
-
217
-
218
-
219
-
220
-
221
-
222
-
223
-
224
-
225
-
226
-
227
-
228
-
229
-
230
-
231
-
232
-
233
-
234
-
235
-
236
-
237
-
238
-
239
-
240
-
241
-
242
-
243
-
244
-
245
-
246
-
247
-
248
-
249
-
250
-
251
-
252
-
253
-
254
-
 255
255 -
 256
256 -
 257
257 -
 258
258 -
 259
259 -
 260
260 -
 261
261 -
 262
262 -
 263
263 -
 264
264 -
 265
265 -
 266
266 -
 267
267 -
 268
268 -
 269
269 -
 270
270 -
 271
271 -
 272
272 -
 273
273 -
 274
274 -
 275
275 -
276
-
277
-
278
-
279
-
280
-
281
-
282
-
283
-
284
-
285
-
286
-
287
-
288
-
289
-
290
-
291
-
292
-
293
-
294
-
295
-
296
-
297
-
298
-
299
-
300
-
301
-
302
-
303
-
304
-
305
-
306
-
307
-
308
-
309
-
310
-
311
-
312
-
313
-
314
-
315
-
316
-
317
-
318
-
319
-
320
-
321
-
322
-
323
-
324
-
325
-
326
-
327
-
328
-
329
-
330
-
331
-
332
-
333
-
334
-
335
-
336
-
337
-
338
-
339
-
340
-
341
-
342
-
343
-
344
-
345
-
346
-
347
-
348
-
349
-
350
-
351
-
352
-
353
-
354
-
355
-
356
-
357
-
358
-
359
-
360
-
361
-
362
-
363
-
364
-
365
-
366
-
367
-
368
-
369
-
370
-
371
-
372
-
373
-
374
-
375
-
376
-
377
-
378
-
379
-
380
-
381
-
382
-
383
-
384
-
385
-
386
-
387
-
388
-
389
-
390
-
391
-
392
-
393
-
394
-
395
-
396
-
397
-
398
-
399
-
400
-
401
-
402
-
403
-
404
-
405
-
406
-
407
-
408
-
409
-
410
-
411
-
412
-
413
-
414
-
415
-
416
-
417
-
418
-
419
-
420
-
421
-
422
-
423
-
424
-
425
-
426
-
427
-
428
-
429
-
430
-
431
-
432
-
433
-
434
-
435
-
436
-
437
-
438
-
439
-
440
 |
 |

263
Overview Operating & Financial Review Corporate Governance Financial Statements Shareholder Information
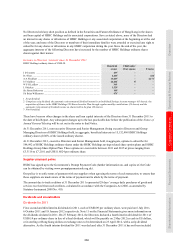
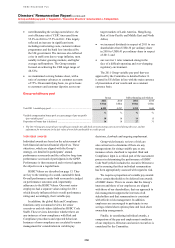
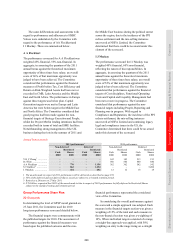
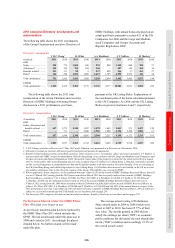
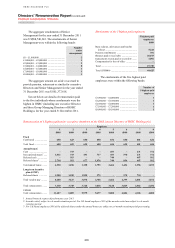
2011 long-term scorecard and performance outcome
Measure
Long-term
target range
Weighting
Actual 2011
performance
Outcome
Return on equity .............................................................. 12% – 15% 15% 10.9%1 –
Cost efficiency ratio ....................................................... 48% – 52% 15% 57.5%1 –
Capital strength ............................................................... >10% 15% 10.1%1 15.0%
Dividends (payout ratio) ................................................. 40% – 60% 15% 42.4%1 15.0%
Strategy ........................................................................... Judgement 10% Judgement 7.5%
Brand equity ...................................................................
Top 3 rating and
improve US$bn value 10%
Top 3 rating but
drop in value2 5.0%
Compliance and reputation ............................................. Judgement 10% Not met –
People and values ........................................................... Judgement 10% Judgement 7.5%
Performance outcome ..................................................... 100% 50.0%
1 As reported in the Annual Report and Accounts 2011.
2 Based on results from The Brand Finance® Banking 500 2012 survey.
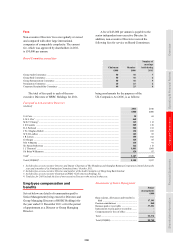
Financial (60% weighting – achieved 30%)
The Committee considered that in the key areas
of Capital Strength and Dividend Progression,
HSBC was meeting its short-term targets and
preparing carefully for the incoming higher
standards embedded within the new regulatory
regime. Accordingly these elements of longer-term
financial performance were fully met.
The Group did not however meet its targets for
Return On Equity or the Cost Efficiency Ratio in
2011. The Committee considered the extent to
which steps had been taken to improve both
metrics over the longer term. In its deliberations,
the Committee noted positively the progress under
the five filters approach to divesting or closing
underperforming and sub-scale businesses, the
business model and organisational efficiency
programmes underway to deliver targeted cost
savings, the focus in terms of capital deployment
on sustainable opportunities within the larger
economies in which the Group has meaningful
positions and in the faster-growing markets which
will drive incremental trade and investment flows,
and lastly the concentration on businesses that take
advantage of the connectivity of the Group’s
geographical reach and global business product
platforms.
The Committee scored progress towards the
Return on Equity and Cost Efficiency Ratio targets
but concluded at this early stage in the application
of the GPSP it would not make any partial award
for such achievement. This will be looked at again
in future years.
Non-financial (40% weighting – achieved 20%)
With regard to Strategy, looking at progress made
on addressing the longer term issues, the
Committee looked favourably on the framework
developed and being actioned to address
underperforming and sub-scale businesses. Greater
clarity has also been brought to the Board on the
options to deliver more value from the Group’s
leading position in mainland China, to develop a
larger Wealth Management business and to reshape
the long term business of HSBC in the US. Given
the clarity delivered, the Committee awarded 75%
achievement for this element.
On People and Values, the Committee awarded
75% of the available opportunity of 10% to reflect
how well and quickly the new management team
has been constructed, positive actions regarding
team building and succession planning, the roll out
of the HSBC Values and the well thought out
reshaping of the organisational structure under the
new leadership team.
In considering Brand Equity the Committee
noted positively the recognition in February 2012
in the Brand Finance® Banking 500 2012 report
that HSBC was judged to be the most valuable
banking brand in the world, rising from third place
one year prior. Despite the no. 1 rating in the Brand
Finance survey the value of the brand (as measured
using Brand Finance’s methodology) decreased
during 2011 and accordingly only 50%
achievement was awarded to this element.
Finally with regard to Compliance and
Reputation, the Committee concluded that as a