HSBC 2011 Annual Report Download - page 70
Download and view the complete annual report
Please find page 70 of the 2011 HSBC annual report below. You can navigate through the pages in the report by either clicking on the pages listed below, or by using the keyword search tool below to find specific information within the annual report.-
 1
1 -
2
-
3
-
4
-
5
-
6
-
7
-
8
-
9
-
10
-
11
-
12
-
13
-
14
-
15
-
16
-
17
-
18
-
19
-
20
-
21
-
22
-
23
-
24
-
25
-
26
-
27
-
28
-
29
-
30
-
31
-
32
-
33
-
34
-
35
-
36
-
37
-
38
-
39
-
40
-
41
-
42
-
43
-
44
-
45
-
46
-
47
-
48
-
49
-
50
-
51
-
52
-
53
-
54
-
55
-
56
-
57
-
58
-
59
-
 60
60 -
 61
61 -
 62
62 -
 63
63 -
 64
64 -
 65
65 -
 66
66 -
 67
67 -
 68
68 -
 69
69 -
 70
70 -
 71
71 -
 72
72 -
 73
73 -
 74
74 -
 75
75 -
 76
76 -
 77
77 -
 78
78 -
 79
79 -
 80
80 -
81
-
82
-
83
-
84
-
85
-
86
-
87
-
88
-
89
-
90
-
91
-
92
-
93
-
94
-
95
-
96
-
97
-
98
-
99
-
100
-
101
-
102
-
103
-
104
-
105
-
106
-
107
-
108
-
109
-
110
-
111
-
112
-
113
-
114
-
115
-
116
-
117
-
118
-
119
-
120
-
121
-
122
-
123
-
124
-
125
-
126
-
127
-
128
-
129
-
130
-
131
-
132
-
133
-
134
-
135
-
136
-
137
-
138
-
139
-
140
-
141
-
142
-
143
-
144
-
145
-
146
-
147
-
148
-
149
-
150
-
151
-
152
-
153
-
154
-
155
-
156
-
157
-
158
-
159
-
160
-
161
-
162
-
163
-
164
-
165
-
166
-
167
-
168
-
169
-
170
-
171
-
172
-
173
-
174
-
175
-
176
-
177
-
178
-
179
-
180
-
181
-
182
-
183
-
184
-
185
-
186
-
187
-
188
-
189
-
190
-
191
-
192
-
193
-
194
-
195
-
196
-
197
-
198
-
199
-
200
-
201
-
202
-
203
-
204
-
205
-
206
-
207
-
208
-
209
-
210
-
211
-
212
-
213
-
214
-
215
-
216
-
217
-
218
-
219
-
220
-
221
-
222
-
223
-
224
-
225
-
226
-
227
-
228
-
229
-
230
-
231
-
232
-
233
-
234
-
235
-
236
-
237
-
238
-
239
-
240
-
241
-
242
-
243
-
244
-
245
-
246
-
247
-
248
-
249
-
250
-
251
-
252
-
253
-
254
-
255
-
256
-
257
-
258
-
259
-
260
-
261
-
262
-
263
-
264
-
265
-
266
-
267
-
268
-
269
-
270
-
271
-
272
-
273
-
274
-
275
-
276
-
277
-
278
-
279
-
280
-
281
-
282
-
283
-
284
-
285
-
286
-
287
-
288
-
289
-
290
-
291
-
292
-
293
-
294
-
295
-
296
-
297
-
298
-
299
-
300
-
301
-
302
-
303
-
304
-
305
-
306
-
307
-
308
-
309
-
310
-
311
-
312
-
313
-
314
-
315
-
316
-
317
-
318
-
319
-
320
-
321
-
322
-
323
-
324
-
325
-
326
-
327
-
328
-
329
-
330
-
331
-
332
-
333
-
334
-
335
-
336
-
337
-
338
-
339
-
340
-
341
-
342
-
343
-
344
-
345
-
346
-
347
-
348
-
349
-
350
-
351
-
352
-
353
-
354
-
355
-
356
-
357
-
358
-
359
-
360
-
361
-
362
-
363
-
364
-
365
-
366
-
367
-
368
-
369
-
370
-
371
-
372
-
373
-
374
-
375
-
376
-
377
-
378
-
379
-
380
-
381
-
382
-
383
-
384
-
385
-
386
-
387
-
388
-
389
-
390
-
391
-
392
-
393
-
394
-
395
-
396
-
397
-
398
-
399
-
400
-
401
-
402
-
403
-
404
-
405
-
406
-
407
-
408
-
409
-
410
-
411
-
412
-
413
-
414
-
415
-
416
-
417
-
418
-
419
-
420
-
421
-
422
-
423
-
424
-
425
-
426
-
427
-
428
-
429
-
430
-
431
-
432
-
433
-
434
-
435
-
436
-
437
-
438
-
439
-
440
 |
 |

HSBC HOLDINGS PLC
Report of the Directors: Operating and Financial Review (continued)
Geographical regions > Hong Kong
68
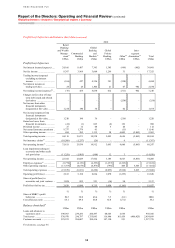
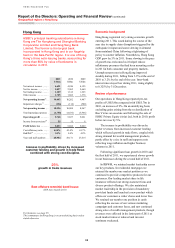
product in RBWM due to unfavourable movements
in the underlying equity indices which resulted in a
corresponding decrease in ‘Net insurance claims
incurred and movement in liabilities to
policyholders’.
These losses were partly offset by higher trading
income in GB&M due to a rise in net interest income
from trading activities from Asian government debt
securities and corporate bonds. Trading income fell
through lower revenues in credit trading as credit
spreads widened in some markets. This was partly
offset by higher revenues in foreign exchange
following greater market volatility in the region and
the collaboration between CMB and GB&M. In
addition, revenues in Equities increased in line with
improved volumes in the business.
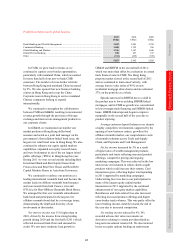
Net expense from financial instruments
designated at fair value was US$537m compared
with gains in 2010 due to investment losses on assets
held by the insurance business as a result of negative
movements in the equity market during the second
half of 2011. To the extent that these investment
losses were attributed to policyholders of unit-linked
insurance policies and insurance contracts with DPF,
there was a corresponding decrease in ‘Net insurance
claims incurred and movement in liabilities to
policyholders’.
Net earned insurance premiums increased by
18% as a result of successful sales initiatives for
deferred annuities, unit-linked products and a
universal life insurance product targeted at high net
worth individuals. This reflected our strategic focus
on wealth management, of which insurance is a
key part. The growth in premiums resulted in a
corresponding increase in ‘Net insurance claims
incurred and movement in liabilities to
policyholders’.
Other operating income increased by 10%,
largely due to an increase in PVIF and higher
revaluation gains on investment properties. PVIF
rose as a result of higher life insurance sales, a
one-off gain of US$135m recognised upon the
refinement of the calculation of the PVIF and a
net increase from updates for experience and
assumptions during 2011. Partially offsetting this
was a higher unwind of cash flows related to the
growing in-force book.
Loan impairment charges and other credit risk
provisions increased by US$42m from a low base
due to a specific impairment charge against one
customer, higher collective impairment charges in
CMB resulting from lending growth, and an
impairment recorded in respect of available-for-sale
Greek sovereign debt securities in GPB. These were
partly offset by releases in GB&M relating to
specific impairment charges raised in 2010.
Operating expenses rose by 7% due to higher
staff costs across the business reflecting wage
inflation in a competitive labour market and a rise
in average staff numbers to support increased
business activity. Performance costs increased in
GB&M due to higher amortisation charges for
previous years’ performance shares and accelerated
expense recognition of current year deferred bonus
awards. During 2011 we incurred US$68m of
restructuring costs as we took steps to improve
efficiency, including the restructuring of our regional
head office.