HSBC 2011 Annual Report Download - page 58
Download and view the complete annual report
Please find page 58 of the 2011 HSBC annual report below. You can navigate through the pages in the report by either clicking on the pages listed below, or by using the keyword search tool below to find specific information within the annual report.-
 1
1 -
2
-
3
-
4
-
5
-
6
-
7
-
8
-
9
-
10
-
11
-
12
-
13
-
14
-
15
-
16
-
17
-
18
-
19
-
20
-
21
-
22
-
23
-
24
-
25
-
26
-
27
-
28
-
29
-
30
-
31
-
32
-
33
-
34
-
35
-
36
-
37
-
38
-
39
-
40
-
41
-
42
-
43
-
44
-
45
-
46
-
47
-
 48
48 -
 49
49 -
 50
50 -
 51
51 -
 52
52 -
 53
53 -
 54
54 -
 55
55 -
 56
56 -
 57
57 -
 58
58 -
 59
59 -
 60
60 -
 61
61 -
 62
62 -
 63
63 -
 64
64 -
 65
65 -
 66
66 -
 67
67 -
 68
68 -
69
-
70
-
71
-
72
-
73
-
74
-
75
-
76
-
77
-
78
-
79
-
80
-
81
-
82
-
83
-
84
-
85
-
86
-
87
-
88
-
89
-
90
-
91
-
92
-
93
-
94
-
95
-
96
-
97
-
98
-
99
-
100
-
101
-
102
-
103
-
104
-
105
-
106
-
107
-
108
-
109
-
110
-
111
-
112
-
113
-
114
-
115
-
116
-
117
-
118
-
119
-
120
-
121
-
122
-
123
-
124
-
125
-
126
-
127
-
128
-
129
-
130
-
131
-
132
-
133
-
134
-
135
-
136
-
137
-
138
-
139
-
140
-
141
-
142
-
143
-
144
-
145
-
146
-
147
-
148
-
149
-
150
-
151
-
152
-
153
-
154
-
155
-
156
-
157
-
158
-
159
-
160
-
161
-
162
-
163
-
164
-
165
-
166
-
167
-
168
-
169
-
170
-
171
-
172
-
173
-
174
-
175
-
176
-
177
-
178
-
179
-
180
-
181
-
182
-
183
-
184
-
185
-
186
-
187
-
188
-
189
-
190
-
191
-
192
-
193
-
194
-
195
-
196
-
197
-
198
-
199
-
200
-
201
-
202
-
203
-
204
-
205
-
206
-
207
-
208
-
209
-
210
-
211
-
212
-
213
-
214
-
215
-
216
-
217
-
218
-
219
-
220
-
221
-
222
-
223
-
224
-
225
-
226
-
227
-
228
-
229
-
230
-
231
-
232
-
233
-
234
-
235
-
236
-
237
-
238
-
239
-
240
-
241
-
242
-
243
-
244
-
245
-
246
-
247
-
248
-
249
-
250
-
251
-
252
-
253
-
254
-
255
-
256
-
257
-
258
-
259
-
260
-
261
-
262
-
263
-
264
-
265
-
266
-
267
-
268
-
269
-
270
-
271
-
272
-
273
-
274
-
275
-
276
-
277
-
278
-
279
-
280
-
281
-
282
-
283
-
284
-
285
-
286
-
287
-
288
-
289
-
290
-
291
-
292
-
293
-
294
-
295
-
296
-
297
-
298
-
299
-
300
-
301
-
302
-
303
-
304
-
305
-
306
-
307
-
308
-
309
-
310
-
311
-
312
-
313
-
314
-
315
-
316
-
317
-
318
-
319
-
320
-
321
-
322
-
323
-
324
-
325
-
326
-
327
-
328
-
329
-
330
-
331
-
332
-
333
-
334
-
335
-
336
-
337
-
338
-
339
-
340
-
341
-
342
-
343
-
344
-
345
-
346
-
347
-
348
-
349
-
350
-
351
-
352
-
353
-
354
-
355
-
356
-
357
-
358
-
359
-
360
-
361
-
362
-
363
-
364
-
365
-
366
-
367
-
368
-
369
-
370
-
371
-
372
-
373
-
374
-
375
-
376
-
377
-
378
-
379
-
380
-
381
-
382
-
383
-
384
-
385
-
386
-
387
-
388
-
389
-
390
-
391
-
392
-
393
-
394
-
395
-
396
-
397
-
398
-
399
-
400
-
401
-
402
-
403
-
404
-
405
-
406
-
407
-
408
-
409
-
410
-
411
-
412
-
413
-
414
-
415
-
416
-
417
-
418
-
419
-
420
-
421
-
422
-
423
-
424
-
425
-
426
-
427
-
428
-
429
-
430
-
431
-
432
-
433
-
434
-
435
-
436
-
437
-
438
-
439
-
440
 |
 |

HSBC HOLDINGS PLC
Report of the Directors: Operating and Financial Review (continued)
Global businesses > Other / Analysis
56
Notes
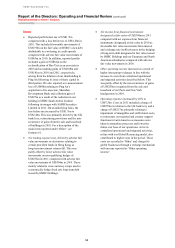
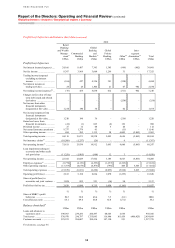
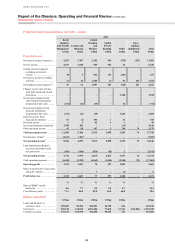
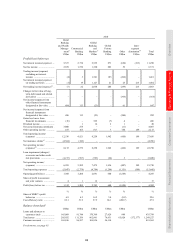
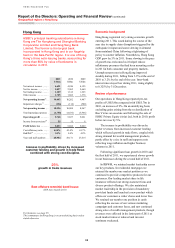
• Reported profit before tax of US$1.7bn
compared with a loss before tax of US$1.2bn in
2010. This included favourable movements of
US$3.9bn on the fair value of HSBC’s own debt
attributable to a widening in credit spreads
compared with adverse fair value movements of
US$63m in 2010. In addition, reported profits
included a gain of US$62m on the
reclassification of Bao Viet as an associate in
2010 and accounting gains of US$188m and
US$181m in 2010 and 2011, respectively,
arising from the dilution of our shareholding in
Ping An following its issue of share capital to
third parties. We also reported a re-measurement
loss of US$48m relating to Ping An’s
acquisition of its associate, Shenzhen
Development Bank and a dilution gain of
US$27m as a result of the reduction in our
holding in HSBC Saudi Arabia Limited
following its merger with SABB Securities
Limited in 2011. On an underlying basis, the
loss before tax increased by US$1.1bn to
US$2.4bn. This was primarily driven by the UK
bank levy, restructuring provisions and the non-
recurrence of gains from the sale and leaseback
of buildings in 2010. For a description of the
main items reported under ‘Other’, see
footnote 61.
• Net trading expense rose, driven by adverse fair
value movements on derivatives relating to
certain provident funds in Hong Kong as
long-term investment returns fell. This was
partly offset by lower adverse fair value
movements on non-qualifying hedges of
US$276m in 2011 compared with adverse fair
value movements of US$304m in 2010. These
mainly related to cross-currency swaps used to
economically hedge fixed rate long-term debt
issued by HSBC Holdings.
• Net income from financial instruments
designated at fair value of US$304m in 2011
compared with net expense from financial
instruments designated at fair value in 2010 as
favourable fair value movements from interest
and exchange rate ineffectiveness in the hedging
of long-term debt designated at fair value issued
by HSBC Holdings and our European and North
American subsidiaries compared with adverse
fair value movements in 2010.
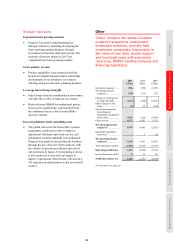
• Other operating income increased as a result of
higher intra-group recharges in line with the
increase in costs from centralised operational
and migrated activities described below. This
was partly offset by the non-recurrence of gains
of US$250m recognised from the sale and
leaseback of our Paris and New York
headquarters in 2010.
• Operating expenses increased by 26% to
US$7.5bn. Costs in 2011 included a charge of
US$570m in relation to the UK bank levy and a
charge of US$217m, primarily relating to
impairment of intangibles and staff related costs,
to restructure our regional and country support
functions in Latin America as measures were
taken to streamline processes and lower the
future cost base of our operations. A rise in
centralised operational and migrated activities,
in line with our Global Resourcing model, also
contributed to higher costs in the period. These
costs are recorded in ‘Other’ and charged to
global businesses through a recharge mechanism
with income reported as ‘Other operating
income’.