HSBC 2011 Annual Report Download - page 51
Download and view the complete annual report
Please find page 51 of the 2011 HSBC annual report below. You can navigate through the pages in the report by either clicking on the pages listed below, or by using the keyword search tool below to find specific information within the annual report.-
 1
1 -
2
-
3
-
4
-
5
-
6
-
7
-
8
-
9
-
10
-
11
-
12
-
13
-
14
-
15
-
16
-
17
-
18
-
19
-
20
-
21
-
22
-
23
-
24
-
25
-
26
-
27
-
28
-
29
-
30
-
31
-
32
-
33
-
34
-
35
-
36
-
37
-
38
-
39
-
40
-
 41
41 -
 42
42 -
 43
43 -
 44
44 -
 45
45 -
 46
46 -
 47
47 -
 48
48 -
 49
49 -
 50
50 -
 51
51 -
 52
52 -
 53
53 -
 54
54 -
 55
55 -
 56
56 -
 57
57 -
 58
58 -
 59
59 -
 60
60 -
 61
61 -
62
-
63
-
64
-
65
-
66
-
67
-
68
-
69
-
70
-
71
-
72
-
73
-
74
-
75
-
76
-
77
-
78
-
79
-
80
-
81
-
82
-
83
-
84
-
85
-
86
-
87
-
88
-
89
-
90
-
91
-
92
-
93
-
94
-
95
-
96
-
97
-
98
-
99
-
100
-
101
-
102
-
103
-
104
-
105
-
106
-
107
-
108
-
109
-
110
-
111
-
112
-
113
-
114
-
115
-
116
-
117
-
118
-
119
-
120
-
121
-
122
-
123
-
124
-
125
-
126
-
127
-
128
-
129
-
130
-
131
-
132
-
133
-
134
-
135
-
136
-
137
-
138
-
139
-
140
-
141
-
142
-
143
-
144
-
145
-
146
-
147
-
148
-
149
-
150
-
151
-
152
-
153
-
154
-
155
-
156
-
157
-
158
-
159
-
160
-
161
-
162
-
163
-
164
-
165
-
166
-
167
-
168
-
169
-
170
-
171
-
172
-
173
-
174
-
175
-
176
-
177
-
178
-
179
-
180
-
181
-
182
-
183
-
184
-
185
-
186
-
187
-
188
-
189
-
190
-
191
-
192
-
193
-
194
-
195
-
196
-
197
-
198
-
199
-
200
-
201
-
202
-
203
-
204
-
205
-
206
-
207
-
208
-
209
-
210
-
211
-
212
-
213
-
214
-
215
-
216
-
217
-
218
-
219
-
220
-
221
-
222
-
223
-
224
-
225
-
226
-
227
-
228
-
229
-
230
-
231
-
232
-
233
-
234
-
235
-
236
-
237
-
238
-
239
-
240
-
241
-
242
-
243
-
244
-
245
-
246
-
247
-
248
-
249
-
250
-
251
-
252
-
253
-
254
-
255
-
256
-
257
-
258
-
259
-
260
-
261
-
262
-
263
-
264
-
265
-
266
-
267
-
268
-
269
-
270
-
271
-
272
-
273
-
274
-
275
-
276
-
277
-
278
-
279
-
280
-
281
-
282
-
283
-
284
-
285
-
286
-
287
-
288
-
289
-
290
-
291
-
292
-
293
-
294
-
295
-
296
-
297
-
298
-
299
-
300
-
301
-
302
-
303
-
304
-
305
-
306
-
307
-
308
-
309
-
310
-
311
-
312
-
313
-
314
-
315
-
316
-
317
-
318
-
319
-
320
-
321
-
322
-
323
-
324
-
325
-
326
-
327
-
328
-
329
-
330
-
331
-
332
-
333
-
334
-
335
-
336
-
337
-
338
-
339
-
340
-
341
-
342
-
343
-
344
-
345
-
346
-
347
-
348
-
349
-
350
-
351
-
352
-
353
-
354
-
355
-
356
-
357
-
358
-
359
-
360
-
361
-
362
-
363
-
364
-
365
-
366
-
367
-
368
-
369
-
370
-
371
-
372
-
373
-
374
-
375
-
376
-
377
-
378
-
379
-
380
-
381
-
382
-
383
-
384
-
385
-
386
-
387
-
388
-
389
-
390
-
391
-
392
-
393
-
394
-
395
-
396
-
397
-
398
-
399
-
400
-
401
-
402
-
403
-
404
-
405
-
406
-
407
-
408
-
409
-
410
-
411
-
412
-
413
-
414
-
415
-
416
-
417
-
418
-
419
-
420
-
421
-
422
-
423
-
424
-
425
-
426
-
427
-
428
-
429
-
430
-
431
-
432
-
433
-
434
-
435
-
436
-
437
-
438
-
439
-
440
 |
 |

49
Overview Operating & Financial Review Corporate Governance Financial Statements Shareholder Information
Review of performance
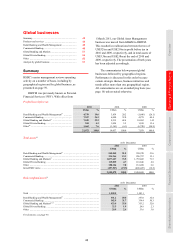
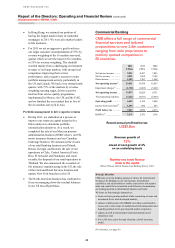
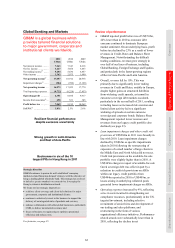
• CMB reported a record profit before tax of
US$7.9bn in 2011, 31% higher than in 2010. On
an underlying basis, profit before tax increased
by 30%, driven by increased net interest income,
a higher share of profits from associates in
mainland China and lower loan impairment
charges. Our 20 priority markets generated more
than 90% of our profit before tax, benefiting
from our strong international network and long-
term approach to customer relationships.
• Revenue grew by 12%, despite increasing
economic, political and regulatory headwinds.
This was largely driven by higher net interest
income from lending activities and from growth
in customer account balances. Net interest
income from lending benefited from the strong
customer loan growth achieved in 2010 which
continued into 2011, albeit at a slower pace
during the latter part of the year. Loans and
advances to customers rose by 12% to
US$262bn as a result of increased demand for
credit in Hong Kong, Rest of Asia-Pacific, Latin
America and Europe. Average customer account
balances also rose, reflecting successful
marketing campaigns, notably in Hong Kong
and Rest of Asia-Pacific as part of a targeted
strategy to support growth in customer lending.
Customer account balances grew by 9% to
US$306bn during 2011.
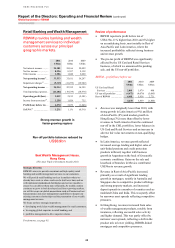
• Net fee income and net trading income benefited
from the strong collaboration with GB&M,
particularly in foreign exchange and interest rate
management products. Net fee income also rose,
reflecting strong volumes and market share in
our trade and payments businesses in Hong
Kong, Rest of Asia-Pacific and Latin America.
• Loan impairment charges and other credit risk
provisions declined by 6% as credit quality
remained strong despite the economic
challenges. Specific impairments decreased,
notably in North America, reflecting improved
credit quality and in Business Banking lower
delinquency levels, partly offset by a specific
provision relating to a single commercial
customer in Latin America. Collective
impairment charges rose reflecting strong
lending growth, notably in Latin America.
• Operating expenses increased by 4%. This was
driven by a rise in costs to support business
growth, along with restructuring costs, partly
offset by a credit of US$212m resulting from a
change in the inflation measure used to calculate
the defined benefit obligation for deferred
pensions in the UK. Our cost efficiency ratio
improved, reflecting our ability to manage our
cost base and rising inflationary pressures while
continuing to invest in key markets for ongoing
expansion.
• Income from associates increased by 41%. The
contribution from BoCom was driven by strong
lending growth, wider deposit spreads following
interest rate rises in mainland China and higher
fee income, including revenue earned from
investment banking, settlements and cards.
Income from Industrial Bank also increased as a
result of strong growth in customer lending and
a rise in fee-based revenue.
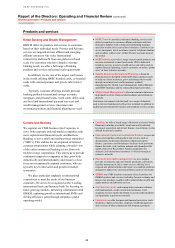
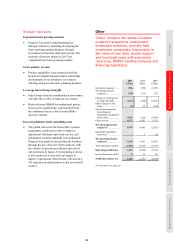
Strategic imperatives
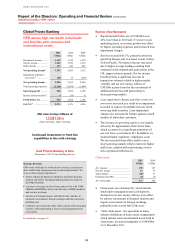
Focus on faster-growing markets while
connecting with developed markets
• In line with our strategy to focus and invest in
faster-growing markets, our operations in Rest
of Asia-Pacific, Latin America, Hong Kong and
the Middle East and North Africa expanded
more quickly than in developed markets.
Revenue from faster growing regions grew by
20% to US$8.5bn, representing 54% of the
CMB total, driven by Brazil, Hong Kong,
mainland China, Mexico, Argentina and
Singapore. Customer lending growth was almost
twice that of Europe and North America, and
accounted for 50% of CMB’s total lending.
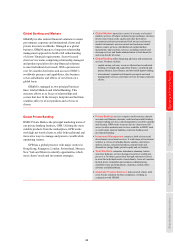
• Total trade and receivables finance revenues
increased by 22% to US$2.6bn, of which 75%
was generated from the faster-growing regions.
Our businesses in these markets expanded more
quickly than in developed regions as we
leveraged our international capabilities to
support our customers.
• Making it easy for customers to do business
with HSBC is at the heart of our approach.
During 2011, we merged our Trade and Supply
Chain and Receivables Finance businesses to
enable us to streamline our product proposition.
It will also help us to expand our Receivables
Finance offering beyond its current locations
and achieve our goal of doubling trade revenue
over the medium term. We also rolled out our
Commodity and Structured Trade Finance
service, strengthening our sales teams in Europe
and Asia and enhancing our infrastructure.
• Revenue from our Payments and Cash
Management products rose by 15%, as they
facilitated increased levels of cross-border
transactions. We continued to roll out the award