HSBC 2011 Annual Report Download - page 123
Download and view the complete annual report
Please find page 123 of the 2011 HSBC annual report below. You can navigate through the pages in the report by either clicking on the pages listed below, or by using the keyword search tool below to find specific information within the annual report.-
 1
1 -
2
-
3
-
4
-
5
-
6
-
7
-
8
-
9
-
10
-
11
-
12
-
13
-
14
-
15
-
16
-
17
-
18
-
19
-
20
-
21
-
22
-
23
-
24
-
25
-
26
-
27
-
28
-
29
-
30
-
31
-
32
-
33
-
34
-
35
-
36
-
37
-
38
-
39
-
40
-
41
-
42
-
43
-
44
-
45
-
46
-
47
-
48
-
49
-
50
-
51
-
52
-
53
-
54
-
55
-
56
-
57
-
58
-
59
-
60
-
61
-
62
-
63
-
64
-
65
-
66
-
67
-
68
-
69
-
70
-
71
-
72
-
73
-
74
-
75
-
76
-
77
-
78
-
79
-
80
-
81
-
82
-
83
-
84
-
85
-
86
-
87
-
88
-
89
-
90
-
91
-
92
-
93
-
94
-
95
-
96
-
97
-
98
-
99
-
100
-
101
-
102
-
103
-
104
-
105
-
106
-
107
-
108
-
109
-
110
-
111
-
112
-
 113
113 -
 114
114 -
 115
115 -
 116
116 -
 117
117 -
 118
118 -
 119
119 -
 120
120 -
 121
121 -
 122
122 -
 123
123 -
 124
124 -
 125
125 -
 126
126 -
 127
127 -
 128
128 -
 129
129 -
 130
130 -
 131
131 -
 132
132 -
 133
133 -
134
-
135
-
136
-
137
-
138
-
139
-
140
-
141
-
142
-
143
-
144
-
145
-
146
-
147
-
148
-
149
-
150
-
151
-
152
-
153
-
154
-
155
-
156
-
157
-
158
-
159
-
160
-
161
-
162
-
163
-
164
-
165
-
166
-
167
-
168
-
169
-
170
-
171
-
172
-
173
-
174
-
175
-
176
-
177
-
178
-
179
-
180
-
181
-
182
-
183
-
184
-
185
-
186
-
187
-
188
-
189
-
190
-
191
-
192
-
193
-
194
-
195
-
196
-
197
-
198
-
199
-
200
-
201
-
202
-
203
-
204
-
205
-
206
-
207
-
208
-
209
-
210
-
211
-
212
-
213
-
214
-
215
-
216
-
217
-
218
-
219
-
220
-
221
-
222
-
223
-
224
-
225
-
226
-
227
-
228
-
229
-
230
-
231
-
232
-
233
-
234
-
235
-
236
-
237
-
238
-
239
-
240
-
241
-
242
-
243
-
244
-
245
-
246
-
247
-
248
-
249
-
250
-
251
-
252
-
253
-
254
-
255
-
256
-
257
-
258
-
259
-
260
-
261
-
262
-
263
-
264
-
265
-
266
-
267
-
268
-
269
-
270
-
271
-
272
-
273
-
274
-
275
-
276
-
277
-
278
-
279
-
280
-
281
-
282
-
283
-
284
-
285
-
286
-
287
-
288
-
289
-
290
-
291
-
292
-
293
-
294
-
295
-
296
-
297
-
298
-
299
-
300
-
301
-
302
-
303
-
304
-
305
-
306
-
307
-
308
-
309
-
310
-
311
-
312
-
313
-
314
-
315
-
316
-
317
-
318
-
319
-
320
-
321
-
322
-
323
-
324
-
325
-
326
-
327
-
328
-
329
-
330
-
331
-
332
-
333
-
334
-
335
-
336
-
337
-
338
-
339
-
340
-
341
-
342
-
343
-
344
-
345
-
346
-
347
-
348
-
349
-
350
-
351
-
352
-
353
-
354
-
355
-
356
-
357
-
358
-
359
-
360
-
361
-
362
-
363
-
364
-
365
-
366
-
367
-
368
-
369
-
370
-
371
-
372
-
373
-
374
-
375
-
376
-
377
-
378
-
379
-
380
-
381
-
382
-
383
-
384
-
385
-
386
-
387
-
388
-
389
-
390
-
391
-
392
-
393
-
394
-
395
-
396
-
397
-
398
-
399
-
400
-
401
-
402
-
403
-
404
-
405
-
406
-
407
-
408
-
409
-
410
-
411
-
412
-
413
-
414
-
415
-
416
-
417
-
418
-
419
-
420
-
421
-
422
-
423
-
424
-
425
-
426
-
427
-
428
-
429
-
430
-
431
-
432
-
433
-
434
-
435
-
436
-
437
-
438
-
439
-
440
 |
 |

121
Overview Operating & Financial Review Corporate Governance Financial Statements Shareholder Information
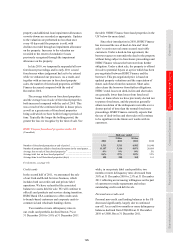
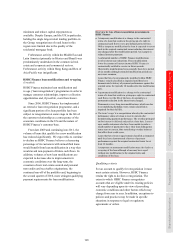
Exposures to countries in the eurozone
(Unaudited)
Our retail activities within the eurozone countries are
limited, with our only significant exposures in
France and Greece. In France, our exposure to
personal lending at 31 December 2011 was
US$14bn. This exposure was mainly in residential
mortgages, loans secured by a national guarantee
scheme and unsecured personal loans, and both
delinquency and impairment charges remained low.
Our exposure within Greece totalled US$1.0bn,
substantially in the form of residential mortgages.
The portfolio remained well secured and
delinquencies stable as we took measures to manage
and contain the risks therein.
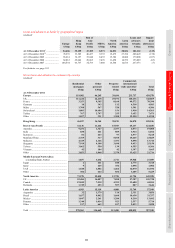
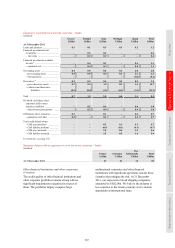
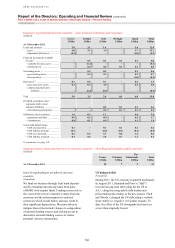
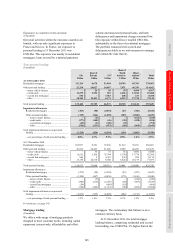
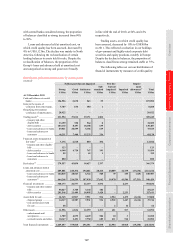
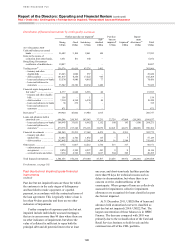
Total personal lending
(Unaudited)
UK
Rest of
Europe US13
Rest of
North
America
Other
regions14 Total
US$m US$m US$m US$m US$m US$m
At 31 December 2011
Residential mortgages ........................................ 111,224 8,678 52,484 20,794 85,783 278,963
Other personal lending ....................................... 22,218 24,027 14,087 7,971 46,359 114,662
– motor vehicle finance .................................. –24 20 29 4,494 4,567
– credit cards .................................................. 11,279 2,192 833 1,262 13,922 29,488
– second lien mortgages ................................. 694 –7,063 468 233 8,458
– other ............................................................. 10,245 21,811 6,171 6,212 27,710 72,149
Total personal lending ........................................ 133,442 32,705 66,571 28,765 132,142 393,625
Impairment allowances
Residential mortgages .................................... (383) (58) (4,551) (27) (302) (5,321)
Other personal lending ................................... (745) (366) (1,659) (109) (1,560) (4,439)
– motor vehicle finance .............................. –(4) – – (164) (168)
– credit cards .............................................. (177) (148) (46) (35) (428) (834)
– second lien mortgages ............................. (42) (1) (740) (9) – (792)
– other ......................................................... (526) (213) (873) (65) (968) (2,645)
Total impairment allowances on personal
lending ............................................................ (1,128) (424) (6,210) (136) (1,862) (9,760)
– as a percentage of total personal lending .... 0.8% 1.3% 9.3% 0.5% 1.4% 2.5%
At 31 December 2010
Residential mortgages ........................................ 103,037 8,581 57,630 21,212 78,221 268,681
Other personal lending ....................................... 25,636 24,463 51,686 8,589 46,265 156,639
– motor vehicle finance .................................. – 35 72 55 5,886 6,048
– credit cards .................................................. 11,612 1,916 33,744 1,334 13,778 62,384
– second lien mortgages ................................. 846 2 9,322 578 422 11,170
– other ............................................................. 13,178 22,510 8,548 6,622 26,179 77,037
Total personal lending ........................................ 128,673 33,044 109,316 29,801 124,486 425,320
Impairment allowances
Residential mortgages .................................... (275) (58) (3,592) (25) (297) (4,247)
Other personal lending ................................... (1,348) (467) (4,436) (179) (1,616) (8,046)
– motor vehicle finance .............................. – (5) – – (244) (249)
– credit cards .............................................. (506) (216) (2,256) (62) (483) (3,523)
– second lien mortgages ............................. (58) – (889) (19) – (966)
– other ......................................................... (784) (246) (1,291) (98) (889) (3,308)
Total impairment allowances on personal
lending ............................................................ (1,623) (525) (8,028) (204) (1,913) (12,293)
– as a percentage of total personal lending .... 1.3% 1.6% 7.3% 0.7% 1.5% 2.9%
For footnotes, see page 185.
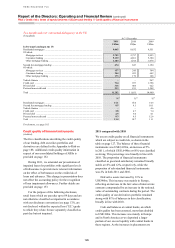
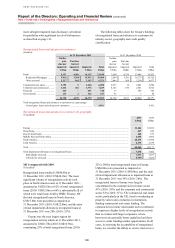
Mortgage lending
(Unaudited)
We offer a wide range of mortgage products
designed to meet customer needs, including capital
repayment, interest-only, affordability and offset
mortgages. The commentary that follows is on a
constant currency basis.
At 31 December 2011, the total mortgage
lending balance, comprising residential and second
lien lending, was US$287bn, 3% higher than at the