HSBC 2011 Annual Report Download - page 42
Download and view the complete annual report
Please find page 42 of the 2011 HSBC annual report below. You can navigate through the pages in the report by either clicking on the pages listed below, or by using the keyword search tool below to find specific information within the annual report.-
 1
1 -
2
-
3
-
4
-
5
-
6
-
7
-
8
-
9
-
10
-
11
-
12
-
13
-
14
-
15
-
16
-
17
-
18
-
19
-
20
-
21
-
22
-
23
-
24
-
25
-
26
-
27
-
28
-
29
-
30
-
31
-
 32
32 -
 33
33 -
 34
34 -
 35
35 -
 36
36 -
 37
37 -
 38
38 -
 39
39 -
 40
40 -
 41
41 -
 42
42 -
 43
43 -
 44
44 -
 45
45 -
 46
46 -
 47
47 -
 48
48 -
 49
49 -
 50
50 -
 51
51 -
 52
52 -
53
-
54
-
55
-
56
-
57
-
58
-
59
-
60
-
61
-
62
-
63
-
64
-
65
-
66
-
67
-
68
-
69
-
70
-
71
-
72
-
73
-
74
-
75
-
76
-
77
-
78
-
79
-
80
-
81
-
82
-
83
-
84
-
85
-
86
-
87
-
88
-
89
-
90
-
91
-
92
-
93
-
94
-
95
-
96
-
97
-
98
-
99
-
100
-
101
-
102
-
103
-
104
-
105
-
106
-
107
-
108
-
109
-
110
-
111
-
112
-
113
-
114
-
115
-
116
-
117
-
118
-
119
-
120
-
121
-
122
-
123
-
124
-
125
-
126
-
127
-
128
-
129
-
130
-
131
-
132
-
133
-
134
-
135
-
136
-
137
-
138
-
139
-
140
-
141
-
142
-
143
-
144
-
145
-
146
-
147
-
148
-
149
-
150
-
151
-
152
-
153
-
154
-
155
-
156
-
157
-
158
-
159
-
160
-
161
-
162
-
163
-
164
-
165
-
166
-
167
-
168
-
169
-
170
-
171
-
172
-
173
-
174
-
175
-
176
-
177
-
178
-
179
-
180
-
181
-
182
-
183
-
184
-
185
-
186
-
187
-
188
-
189
-
190
-
191
-
192
-
193
-
194
-
195
-
196
-
197
-
198
-
199
-
200
-
201
-
202
-
203
-
204
-
205
-
206
-
207
-
208
-
209
-
210
-
211
-
212
-
213
-
214
-
215
-
216
-
217
-
218
-
219
-
220
-
221
-
222
-
223
-
224
-
225
-
226
-
227
-
228
-
229
-
230
-
231
-
232
-
233
-
234
-
235
-
236
-
237
-
238
-
239
-
240
-
241
-
242
-
243
-
244
-
245
-
246
-
247
-
248
-
249
-
250
-
251
-
252
-
253
-
254
-
255
-
256
-
257
-
258
-
259
-
260
-
261
-
262
-
263
-
264
-
265
-
266
-
267
-
268
-
269
-
270
-
271
-
272
-
273
-
274
-
275
-
276
-
277
-
278
-
279
-
280
-
281
-
282
-
283
-
284
-
285
-
286
-
287
-
288
-
289
-
290
-
291
-
292
-
293
-
294
-
295
-
296
-
297
-
298
-
299
-
300
-
301
-
302
-
303
-
304
-
305
-
306
-
307
-
308
-
309
-
310
-
311
-
312
-
313
-
314
-
315
-
316
-
317
-
318
-
319
-
320
-
321
-
322
-
323
-
324
-
325
-
326
-
327
-
328
-
329
-
330
-
331
-
332
-
333
-
334
-
335
-
336
-
337
-
338
-
339
-
340
-
341
-
342
-
343
-
344
-
345
-
346
-
347
-
348
-
349
-
350
-
351
-
352
-
353
-
354
-
355
-
356
-
357
-
358
-
359
-
360
-
361
-
362
-
363
-
364
-
365
-
366
-
367
-
368
-
369
-
370
-
371
-
372
-
373
-
374
-
375
-
376
-
377
-
378
-
379
-
380
-
381
-
382
-
383
-
384
-
385
-
386
-
387
-
388
-
389
-
390
-
391
-
392
-
393
-
394
-
395
-
396
-
397
-
398
-
399
-
400
-
401
-
402
-
403
-
404
-
405
-
406
-
407
-
408
-
409
-
410
-
411
-
412
-
413
-
414
-
415
-
416
-
417
-
418
-
419
-
420
-
421
-
422
-
423
-
424
-
425
-
426
-
427
-
428
-
429
-
430
-
431
-
432
-
433
-
434
-
435
-
436
-
437
-
438
-
439
-
440
 |
 |

HSBC HOLDINGS PLC
Report of the Directors: Operating and Financial Review (continued)
Financial summary > Critical accounting policies
40
Valuation of financial instruments
Our accounting policy for determining the fair value
of financial instruments is described in Note 2d on
the Financial Statements.
The best evidence of fair value is a quoted price
in an actively traded market. In the event that the
market for a financial instrument is not active, a
valuation technique is used. The majority of
valuation techniques employ only observable
market data and so the reliability of the fair value
measurement is high. However, certain financial
instruments are valued on the basis of valuation
techniques that feature one or more significant
market inputs that are unobservable. Valuation
techniques that rely to a greater extent on
unobservable inputs require a higher level of
management judgement to calculate a fair value
than those based wholly on observable inputs.
Valuation techniques used to calculate fair
values are discussed in Note 16 on the Financial
Statements. The main assumptions and estimates
which management consider when applying a model
with valuation techniques are:
• the likelihood and expected timing of future cash
flows on the instrument. These cash flows are
estimated based on the terms of the instrument,
and judgement may be required when the ability
of the counterparty to service the instrument in
accordance with the contractual terms is in
doubt. Future cash flows may be sensitive to
changes in market rates;
• selecting an appropriate discount rate for
the instrument. The determination of this rate
is based on an assessment of what a market
participant would regard as the appropriate
spread of the rate for the instrument over the
appropriate risk-free rate; and
• judgement to determine what model to use to
calculate fair value in areas where the choice of
valuation model is particularly subjective, for
example, when valuing complex derivative
products.
When applying a model with unobservable
inputs, estimates are made to reflect uncertainties
in fair values resulting from a lack of market data
inputs, for example, as a result of illiquidity in
the market. For these instruments, the fair value
measurement is less reliable. Inputs into valuations
based on unobservable data are inherently uncertain
because there is little or no current market data
available from which to determine the level at which
an arm’s length transaction would occur under
normal business conditions. However, in most cases
there is some market data available on which to base
a determination of fair value, for example historical
data, and the fair values of most financial
instruments are based on some market observable
inputs even when unobservable inputs are
significant.
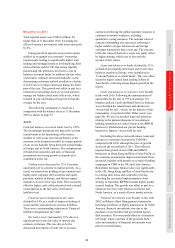
The value of financial assets and liabilities
measured at fair value using a valuation technique
was US$665bn (2010: US$599bn) and US$569bn
(2010: US$499bn), respectively or 61% (2010: 56%)
of total financial assets and 82% (2010: 77%) of
total financial liabilities measured at fair value.
Disclosures of the types and amounts of
adjustments made in determining the fair value of
financial instruments measured at fair value using
valuation techniques, and a sensitivity analysis of
fair values for financial instruments with significant
unobservable inputs to reasonably possible
alternative assumptions, can be found in Note 16 on
the Financial Statements. Given the uncertainty and
subjective nature of valuing financial instruments at
fair value, it is possible that the outcomes in the next
financial year could differ from the assumptions
used, and this could result in a material adjustment
to the carrying amount of financial instruments
measured at fair value.
Impairment of available-for-sale financial
assets
Our accounting policy for impairment of available-
for-sale financial assets is described in Note 2j on
the Financial Statements.
At 31 December 2011, our total available-for-
sale financial assets amounted to US$379bn (2010:
US$381bn), of which US$372bn or 98% (2010:
US$373bn; 98%) were debt securities. The
available-for-sale fair value reserve relating to
debt securities amounted to a deficit of US$4.9bn
(2010: deficit of US$6.2bn). A deficit in the
available-for-sale fair value reserve occurs on debt
securities when the fair value of a relevant security
is less than its acquisition cost (net of any principal
repayments and amortisation) after deducting any
impairment losses recognised.
Management is required to exercise judgement
in determining whether there is objective evidence
that an impairment loss has occurred. Once an
impairment has been identified, the amount of
impairment loss is measured with reference to
the fair value of the asset. More information on
assumptions and estimates requiring management
judgement relating to the determination of fair
values of financial instruments is provided above
in ‘Valuation of financial instruments’.