HSBC 2011 Annual Report Download - page 334
Download and view the complete annual report
Please find page 334 of the 2011 HSBC annual report below. You can navigate through the pages in the report by either clicking on the pages listed below, or by using the keyword search tool below to find specific information within the annual report.-
 1
1 -
2
-
3
-
4
-
5
-
6
-
7
-
8
-
9
-
10
-
11
-
12
-
13
-
14
-
15
-
16
-
17
-
18
-
19
-
20
-
21
-
22
-
23
-
24
-
25
-
26
-
27
-
28
-
29
-
30
-
31
-
32
-
33
-
34
-
35
-
36
-
37
-
38
-
39
-
40
-
41
-
42
-
43
-
44
-
45
-
46
-
47
-
48
-
49
-
50
-
51
-
52
-
53
-
54
-
55
-
56
-
57
-
58
-
59
-
60
-
61
-
62
-
63
-
64
-
65
-
66
-
67
-
68
-
69
-
70
-
71
-
72
-
73
-
74
-
75
-
76
-
77
-
78
-
79
-
80
-
81
-
82
-
83
-
84
-
85
-
86
-
87
-
88
-
89
-
90
-
91
-
92
-
93
-
94
-
95
-
96
-
97
-
98
-
99
-
100
-
101
-
102
-
103
-
104
-
105
-
106
-
107
-
108
-
109
-
110
-
111
-
112
-
113
-
114
-
115
-
116
-
117
-
118
-
119
-
120
-
121
-
122
-
123
-
124
-
125
-
126
-
127
-
128
-
129
-
130
-
131
-
132
-
133
-
134
-
135
-
136
-
137
-
138
-
139
-
140
-
141
-
142
-
143
-
144
-
145
-
146
-
147
-
148
-
149
-
150
-
151
-
152
-
153
-
154
-
155
-
156
-
157
-
158
-
159
-
160
-
161
-
162
-
163
-
164
-
165
-
166
-
167
-
168
-
169
-
170
-
171
-
172
-
173
-
174
-
175
-
176
-
177
-
178
-
179
-
180
-
181
-
182
-
183
-
184
-
185
-
186
-
187
-
188
-
189
-
190
-
191
-
192
-
193
-
194
-
195
-
196
-
197
-
198
-
199
-
200
-
201
-
202
-
203
-
204
-
205
-
206
-
207
-
208
-
209
-
210
-
211
-
212
-
213
-
214
-
215
-
216
-
217
-
218
-
219
-
220
-
221
-
222
-
223
-
224
-
225
-
226
-
227
-
228
-
229
-
230
-
231
-
232
-
233
-
234
-
235
-
236
-
237
-
238
-
239
-
240
-
241
-
242
-
243
-
244
-
245
-
246
-
247
-
248
-
249
-
250
-
251
-
252
-
253
-
254
-
255
-
256
-
257
-
258
-
259
-
260
-
261
-
262
-
263
-
264
-
265
-
266
-
267
-
268
-
269
-
270
-
271
-
272
-
273
-
274
-
275
-
276
-
277
-
278
-
279
-
280
-
281
-
282
-
283
-
284
-
285
-
286
-
287
-
288
-
289
-
290
-
291
-
292
-
293
-
294
-
295
-
296
-
297
-
298
-
299
-
300
-
301
-
302
-
303
-
304
-
305
-
306
-
307
-
308
-
309
-
310
-
311
-
312
-
313
-
314
-
315
-
316
-
317
-
318
-
319
-
320
-
321
-
322
-
323
-
 324
324 -
 325
325 -
 326
326 -
 327
327 -
 328
328 -
 329
329 -
 330
330 -
 331
331 -
 332
332 -
 333
333 -
 334
334 -
 335
335 -
 336
336 -
 337
337 -
 338
338 -
 339
339 -
 340
340 -
 341
341 -
 342
342 -
 343
343 -
 344
344 -
345
-
346
-
347
-
348
-
349
-
350
-
351
-
352
-
353
-
354
-
355
-
356
-
357
-
358
-
359
-
360
-
361
-
362
-
363
-
364
-
365
-
366
-
367
-
368
-
369
-
370
-
371
-
372
-
373
-
374
-
375
-
376
-
377
-
378
-
379
-
380
-
381
-
382
-
383
-
384
-
385
-
386
-
387
-
388
-
389
-
390
-
391
-
392
-
393
-
394
-
395
-
396
-
397
-
398
-
399
-
400
-
401
-
402
-
403
-
404
-
405
-
406
-
407
-
408
-
409
-
410
-
411
-
412
-
413
-
414
-
415
-
416
-
417
-
418
-
419
-
420
-
421
-
422
-
423
-
424
-
425
-
426
-
427
-
428
-
429
-
430
-
431
-
432
-
433
-
434
-
435
-
436
-
437
-
438
-
439
-
440
 |
 |

332
HSBC HOLDINGS PLC
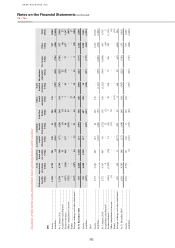
Notes on the Financial Statements (continued)
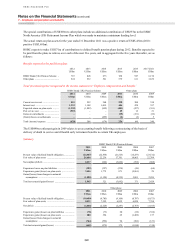
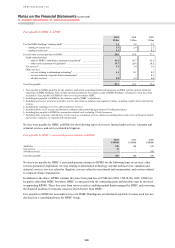
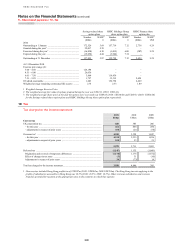
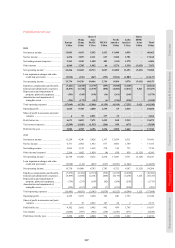
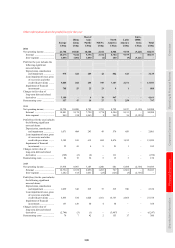
10 – Tax
Movement of deferred tax assets and liabilities before offsetting balances within countries
Retirement
benefits
Loan
impairment
provisions
Unused tax
losses and
tax credits
Accelerated
capital
allowances
Available-
for-sale
investments
Cash flow
hedges
Share-
based
payments
Assets
leased to
customers
Revaluation
of property Fee income Other Total
US$m US$m US$m US$m US$m US$m US$m US$m US$m US$m US$m US$m
2011
Assets ......................................................... 1,538 4,799 351 109 11 352 241 – – – 957 8,358
Liabilities ................................................... – – (3) (126) (135) (88) – (707) (225) (756) (400) (2,440)
At 1 January 2011 ..................................... 1,538 4,799 348 (17) (124) 264 241 (707) (225) (756) 557 5,918
Acquisitions and disposals ........................ 3 – 11 – (3) (5) 1 – 22 – (6) 23
Income statement ....................................... (437) (224) 945 137 10 14 1 93 (36) 17 627 1,147
Other comprehensive income .................... (322) – – – (533) 53 – – – – – (802)
Equity ........................................................ – – – – – – 27 – – – – 27
Foreign exchange and other adjustments .. (147) (127) 24 (3) 93 24 16 33 12 2 (32) (105)
At 31 December 2011 .............................. 635 4,448 1,328 117 (557) 350 286 (581) (227) (737) 1,146 6,208
Assets ......................................................... 742 4,448 1,328 117 – 487 286 14 – – 1,709 9,131
Liabilities ................................................... (107) – – – (557) (137) – (595) (227) (737) (563) (2,923)
2010
Assets ......................................................... 1,772 6,363 407 215 68 229 196 – – – 1,535 10,785
Liabilities ................................................... – – – (129) (340) (91) – (1,121) (399) (1,080) (842) (4,002)
At 1 January 2010 ..................................... 1,772 6,363 407 86 (272) 138 196 (1,121) (399) (1,080) 693 6,783
Acquisitions and disposals ........................ – 8 – – 12 (2) – – – – (16) 2
Income statement ....................................... (468) (1,702) (70) 14 (16) 3 50 250 75 386 343 (1,135)
Other comprehensive income .................... (1) – – – (73) 70 – – – – – (4)
Equity ........................................................ – – – – – – (14) – – – – (14)
Foreign exchange and other adjustments .. 235 130 11 (117) 225 55 9 164 99 (62) (463) 286
At 31 December 2010 ............................... 1,538 4,799 348 (17) (124) 264 241 (707) (225) (756) 557 5,918
Assets ......................................................... 1,538 4,799 351 109 11 352 241 – – – 957 8,358
Liabilities ................................................... – – (3) (126) (135) (88) – (707) (225) (756) (400) (2,440)