HSBC 2011 Annual Report Download - page 62
Download and view the complete annual report
Please find page 62 of the 2011 HSBC annual report below. You can navigate through the pages in the report by either clicking on the pages listed below, or by using the keyword search tool below to find specific information within the annual report.-
 1
1 -
2
-
3
-
4
-
5
-
6
-
7
-
8
-
9
-
10
-
11
-
12
-
13
-
14
-
15
-
16
-
17
-
18
-
19
-
20
-
21
-
22
-
23
-
24
-
25
-
26
-
27
-
28
-
29
-
30
-
31
-
32
-
33
-
34
-
35
-
36
-
37
-
38
-
39
-
40
-
41
-
42
-
43
-
44
-
45
-
46
-
47
-
48
-
49
-
50
-
51
-
 52
52 -
 53
53 -
 54
54 -
 55
55 -
 56
56 -
 57
57 -
 58
58 -
 59
59 -
 60
60 -
 61
61 -
 62
62 -
 63
63 -
 64
64 -
 65
65 -
 66
66 -
 67
67 -
 68
68 -
 69
69 -
 70
70 -
 71
71 -
 72
72 -
73
-
74
-
75
-
76
-
77
-
78
-
79
-
80
-
81
-
82
-
83
-
84
-
85
-
86
-
87
-
88
-
89
-
90
-
91
-
92
-
93
-
94
-
95
-
96
-
97
-
98
-
99
-
100
-
101
-
102
-
103
-
104
-
105
-
106
-
107
-
108
-
109
-
110
-
111
-
112
-
113
-
114
-
115
-
116
-
117
-
118
-
119
-
120
-
121
-
122
-
123
-
124
-
125
-
126
-
127
-
128
-
129
-
130
-
131
-
132
-
133
-
134
-
135
-
136
-
137
-
138
-
139
-
140
-
141
-
142
-
143
-
144
-
145
-
146
-
147
-
148
-
149
-
150
-
151
-
152
-
153
-
154
-
155
-
156
-
157
-
158
-
159
-
160
-
161
-
162
-
163
-
164
-
165
-
166
-
167
-
168
-
169
-
170
-
171
-
172
-
173
-
174
-
175
-
176
-
177
-
178
-
179
-
180
-
181
-
182
-
183
-
184
-
185
-
186
-
187
-
188
-
189
-
190
-
191
-
192
-
193
-
194
-
195
-
196
-
197
-
198
-
199
-
200
-
201
-
202
-
203
-
204
-
205
-
206
-
207
-
208
-
209
-
210
-
211
-
212
-
213
-
214
-
215
-
216
-
217
-
218
-
219
-
220
-
221
-
222
-
223
-
224
-
225
-
226
-
227
-
228
-
229
-
230
-
231
-
232
-
233
-
234
-
235
-
236
-
237
-
238
-
239
-
240
-
241
-
242
-
243
-
244
-
245
-
246
-
247
-
248
-
249
-
250
-
251
-
252
-
253
-
254
-
255
-
256
-
257
-
258
-
259
-
260
-
261
-
262
-
263
-
264
-
265
-
266
-
267
-
268
-
269
-
270
-
271
-
272
-
273
-
274
-
275
-
276
-
277
-
278
-
279
-
280
-
281
-
282
-
283
-
284
-
285
-
286
-
287
-
288
-
289
-
290
-
291
-
292
-
293
-
294
-
295
-
296
-
297
-
298
-
299
-
300
-
301
-
302
-
303
-
304
-
305
-
306
-
307
-
308
-
309
-
310
-
311
-
312
-
313
-
314
-
315
-
316
-
317
-
318
-
319
-
320
-
321
-
322
-
323
-
324
-
325
-
326
-
327
-
328
-
329
-
330
-
331
-
332
-
333
-
334
-
335
-
336
-
337
-
338
-
339
-
340
-
341
-
342
-
343
-
344
-
345
-
346
-
347
-
348
-
349
-
350
-
351
-
352
-
353
-
354
-
355
-
356
-
357
-
358
-
359
-
360
-
361
-
362
-
363
-
364
-
365
-
366
-
367
-
368
-
369
-
370
-
371
-
372
-
373
-
374
-
375
-
376
-
377
-
378
-
379
-
380
-
381
-
382
-
383
-
384
-
385
-
386
-
387
-
388
-
389
-
390
-
391
-
392
-
393
-
394
-
395
-
396
-
397
-
398
-
399
-
400
-
401
-
402
-
403
-
404
-
405
-
406
-
407
-
408
-
409
-
410
-
411
-
412
-
413
-
414
-
415
-
416
-
417
-
418
-
419
-
420
-
421
-
422
-
423
-
424
-
425
-
426
-
427
-
428
-
429
-
430
-
431
-
432
-
433
-
434
-
435
-
436
-
437
-
438
-
439
-
440
 |
 |

HSBC HOLDINGS PLC
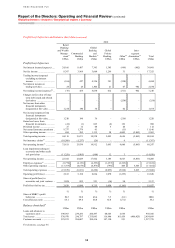
Report of the Directors: Operating and Financial Review (continued)
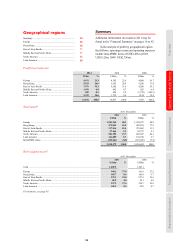
Geographical regions > Europe
60
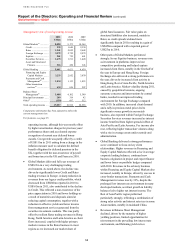
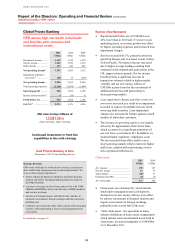
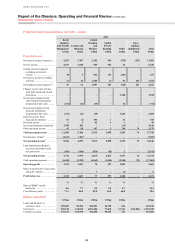
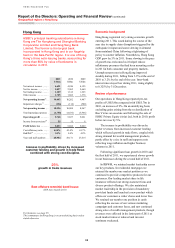
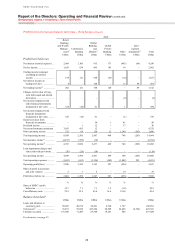
Europe
Our principal banking subsidiaries in Europe
are HSBC Bank plc in the UK, HSBC France S.A.,
HSBC Bank A.S. in Turkey, HSBC Bank Malta
p.l.c., HSBC Private Bank (Suisse) S.A. and
HSBC Trinkaus & Burkhardt AG. Through these
subsidiaries we provide a wide range of
banking, treasury and financial services to
personal, commercial and corporate customers
across Europe.
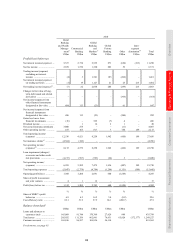
2011 2010 2009
US$m US$m US$m
Net interest income .......... 11,001 11,250 12,268
Net fee income ................. 6,236 6,371 6,267
Net trading income .......... 2,161 2,863 5,459
Other income/(expense) ... 4,848 2,266 (450)
Net operating income52 .. 24,246 22,750 23,544
Impairment charges53 ....... (2,512) (3,020) (5,568)
Net operating income .... 21,734 19,730 17,976
Total operating expenses . (17,069) (15,445) (13,988)
Operating profit ............. 4,665 4,285 3,988
Income from associates54 .. 6 17 21
Profit before tax ............. 4,671 4,302 4,009
Cost efficiency ratio ........ 70.4% 67.9% 59.4%
RoRWA55 ......................... 1.5% 1.3% 1.2%
Year-end staff numbers ... 74,892 75,698 76,703
Credit and Rates
revenues within GB&M
adversely affected by
eurozone uncertainty
Best Debt House in Western Europe
(Euromoney Awards for Excellence 2011)
53%
reduction in RBWM
loan impairment charges
For footnotes, see page 95.
The commentary on Europe is on an underlying basis unless stated
otherwise.
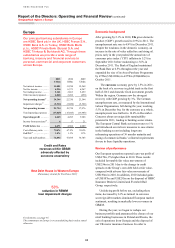
Economic background
After growing by 2.1% in 2010, UK gross domestic
product (‘GDP’) growth eased to 0.9% in 2011. The
unemployment rate rose to 8.4% in December 2011.
Despite the weakness in the domestic economy, an
increase in the rate of value added tax and rising oil
prices early in the year pushed the annual rate of
consumer price index (‘CPI’) inflation to 5.2% in
September 2011 before moderating to 3.6% in
December 2011. The Bank of England maintained
the Bank Rate at 0.5% throughout the year and
expanded the size of its Asset Purchase Programme
by £75bn (US$120bn) to £275bn (US$440bn) in
October 2011.
The eurozone economy grew by 1.5% in 2011,
on the back of a recovery in global trade in the first
half of 2011 and domestic fixed investment growth.
Within the region, Germany saw the strongest
recovery with GDP growing by 3%. The German
unemployment rate, as measured by the International
Labour Organisation, fell during the year, touching
5.5% in December but, for the eurozone as a whole,
unemployment rose further to 10.4% in December.
Concerns about sovereign debt sustainability
persisted in 2011, leading to banking sector strains.
The European Central Bank cut interest rates to 1%
and introduced several new measures to ease strains
in the banking sector including long-term
refinancing operations of 36 months maturity and
easing of commercial banks’ collateral requirements
for use in these liquidity operations.
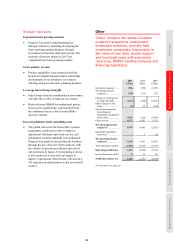
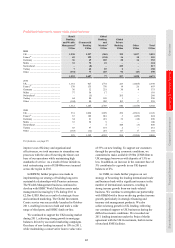
Review of performance
Our European operations reported a pre-tax profit of
US$4.7bn, 9% higher than in 2010. These results
included favourable fair value movements of
US$2.9bn in 2011 due to the change in credit
spreads on the Group’s own debt held at fair value,
compared with adverse fair value movements of
US$198m in 2010. In addition, 2010 included gains
of US$107m and US$255m on the disposal of HSBC
Insurance Brokers Limited and Eversholt Rail
Group, respectively.
Underlying profit before tax, excluding these
items, decreased by 61% as turmoil in eurozone
sovereign debt markets dominated European market
sentiment, resulting in markedly lower revenues in
GB&M.
During the year, we began to reshape our
business portfolio and announced the closure of our
retail banking businesses in Poland and Russia, the
exit of operations from Georgia and the disposal of
our UK motor insurance business. In order to