HSBC 2011 Annual Report Download - page 282
Download and view the complete annual report
Please find page 282 of the 2011 HSBC annual report below. You can navigate through the pages in the report by either clicking on the pages listed below, or by using the keyword search tool below to find specific information within the annual report.-
 1
1 -
2
-
3
-
4
-
5
-
6
-
7
-
8
-
9
-
10
-
11
-
12
-
13
-
14
-
15
-
16
-
17
-
18
-
19
-
20
-
21
-
22
-
23
-
24
-
25
-
26
-
27
-
28
-
29
-
30
-
31
-
32
-
33
-
34
-
35
-
36
-
37
-
38
-
39
-
40
-
41
-
42
-
43
-
44
-
45
-
46
-
47
-
48
-
49
-
50
-
51
-
52
-
53
-
54
-
55
-
56
-
57
-
58
-
59
-
60
-
61
-
62
-
63
-
64
-
65
-
66
-
67
-
68
-
69
-
70
-
71
-
72
-
73
-
74
-
75
-
76
-
77
-
78
-
79
-
80
-
81
-
82
-
83
-
84
-
85
-
86
-
87
-
88
-
89
-
90
-
91
-
92
-
93
-
94
-
95
-
96
-
97
-
98
-
99
-
100
-
101
-
102
-
103
-
104
-
105
-
106
-
107
-
108
-
109
-
110
-
111
-
112
-
113
-
114
-
115
-
116
-
117
-
118
-
119
-
120
-
121
-
122
-
123
-
124
-
125
-
126
-
127
-
128
-
129
-
130
-
131
-
132
-
133
-
134
-
135
-
136
-
137
-
138
-
139
-
140
-
141
-
142
-
143
-
144
-
145
-
146
-
147
-
148
-
149
-
150
-
151
-
152
-
153
-
154
-
155
-
156
-
157
-
158
-
159
-
160
-
161
-
162
-
163
-
164
-
165
-
166
-
167
-
168
-
169
-
170
-
171
-
172
-
173
-
174
-
175
-
176
-
177
-
178
-
179
-
180
-
181
-
182
-
183
-
184
-
185
-
186
-
187
-
188
-
189
-
190
-
191
-
192
-
193
-
194
-
195
-
196
-
197
-
198
-
199
-
200
-
201
-
202
-
203
-
204
-
205
-
206
-
207
-
208
-
209
-
210
-
211
-
212
-
213
-
214
-
215
-
216
-
217
-
218
-
219
-
220
-
221
-
222
-
223
-
224
-
225
-
226
-
227
-
228
-
229
-
230
-
231
-
232
-
233
-
234
-
235
-
236
-
237
-
238
-
239
-
240
-
241
-
242
-
243
-
244
-
245
-
246
-
247
-
248
-
249
-
250
-
251
-
252
-
253
-
254
-
255
-
256
-
257
-
258
-
259
-
260
-
261
-
262
-
263
-
264
-
265
-
266
-
267
-
268
-
269
-
270
-
271
-
 272
272 -
 273
273 -
 274
274 -
 275
275 -
 276
276 -
 277
277 -
 278
278 -
 279
279 -
 280
280 -
 281
281 -
 282
282 -
 283
283 -
 284
284 -
 285
285 -
 286
286 -
 287
287 -
 288
288 -
 289
289 -
 290
290 -
 291
291 -
 292
292 -
293
-
294
-
295
-
296
-
297
-
298
-
299
-
300
-
301
-
302
-
303
-
304
-
305
-
306
-
307
-
308
-
309
-
310
-
311
-
312
-
313
-
314
-
315
-
316
-
317
-
318
-
319
-
320
-
321
-
322
-
323
-
324
-
325
-
326
-
327
-
328
-
329
-
330
-
331
-
332
-
333
-
334
-
335
-
336
-
337
-
338
-
339
-
340
-
341
-
342
-
343
-
344
-
345
-
346
-
347
-
348
-
349
-
350
-
351
-
352
-
353
-
354
-
355
-
356
-
357
-
358
-
359
-
360
-
361
-
362
-
363
-
364
-
365
-
366
-
367
-
368
-
369
-
370
-
371
-
372
-
373
-
374
-
375
-
376
-
377
-
378
-
379
-
380
-
381
-
382
-
383
-
384
-
385
-
386
-
387
-
388
-
389
-
390
-
391
-
392
-
393
-
394
-
395
-
396
-
397
-
398
-
399
-
400
-
401
-
402
-
403
-
404
-
405
-
406
-
407
-
408
-
409
-
410
-
411
-
412
-
413
-
414
-
415
-
416
-
417
-
418
-
419
-
420
-
421
-
422
-
423
-
424
-
425
-
426
-
427
-
428
-
429
-
430
-
431
-
432
-
433
-
434
-
435
-
436
-
437
-
438
-
439
-
440
 |
 |

HSBC HOLDINGS PLC
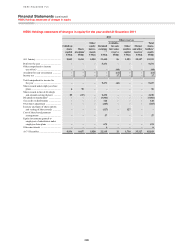
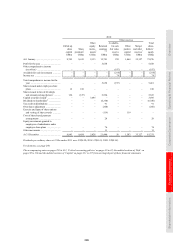
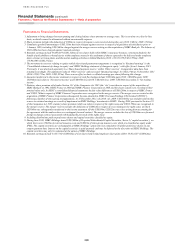
Financial Statements (continued)
Consolidated statement of comprehensive income / Consolidated balance sheet
280
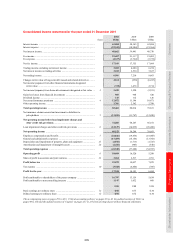
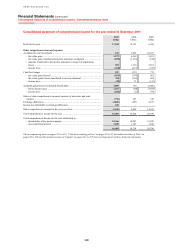
Consolidated statement of comprehensive income for the year ended 31 December 2011
2011 2010 2009
US$m US$m US$m
Profit for the year ........................................................................................................ 17,944 14,191 6,694
Other comprehensive income/(expense)
Available-for-sale investments ................................................................................... 674 5,835 10,817
– fair value gains ................................................................................................... 1,279 6,368 9,821
– fair value gains transferred to income statement on disposal ............................ (820) (1,174) (648)
– amounts transferred to the income statement in respect of impairment
losses .................................................................................................................. 583 1,118 2,391
– income taxes ....................................................................................................... (368) (477) (747)
Cash flow hedges ........................................................................................................ 187 (271) 772
– fair value gains/(losses) ...................................................................................... (581) (178) 481
– fair value (gains)/losses transferred to income statement .................................. 788 (164) 808
– income taxes ....................................................................................................... (20) 71 (517)
Actuarial gains/(losses) on defined benefit plans ...................................................... 1,009 (61) (2,608)
– before income taxes ............................................................................................ 1,267 (60) (3,586)
– income taxes ....................................................................................................... (258) (1) 978
Share of other comprehensive income/(expense) of associates and joint
ventures .................................................................................................................. (710) 107 149
Exchange differences .................................................................................................. (2,865) (567) 4,975
Income tax attributable to exchange differences ........................................................ 165 – –
Other comprehensive income for the year, net of tax ................................................ (1,540) 5,043 14,105
Total comprehensive income for the year .................................................................. 16,404 19,234 20,799
Total comprehensive income for the year attributable to:
– shareholders of the parent company .................................................................. 15,366 18,087 19,529
– non-controlling interests .................................................................................... 1,038 1,147 1,270
16,404 19,234 20,799
The accompanying notes on pages 291 to 413, ‘Critical accounting policies’ on pages 38 to 42, the audited sections of ‘Risk’ on
pages 98 to 210 and the audited sections of ‘Capital’ on pages 211 to 217 form an integral part of these financial statements.