HSBC 2011 Annual Report Download - page 319
Download and view the complete annual report
Please find page 319 of the 2011 HSBC annual report below. You can navigate through the pages in the report by either clicking on the pages listed below, or by using the keyword search tool below to find specific information within the annual report.-
 1
1 -
2
-
3
-
4
-
5
-
6
-
7
-
8
-
9
-
10
-
11
-
12
-
13
-
14
-
15
-
16
-
17
-
18
-
19
-
20
-
21
-
22
-
23
-
24
-
25
-
26
-
27
-
28
-
29
-
30
-
31
-
32
-
33
-
34
-
35
-
36
-
37
-
38
-
39
-
40
-
41
-
42
-
43
-
44
-
45
-
46
-
47
-
48
-
49
-
50
-
51
-
52
-
53
-
54
-
55
-
56
-
57
-
58
-
59
-
60
-
61
-
62
-
63
-
64
-
65
-
66
-
67
-
68
-
69
-
70
-
71
-
72
-
73
-
74
-
75
-
76
-
77
-
78
-
79
-
80
-
81
-
82
-
83
-
84
-
85
-
86
-
87
-
88
-
89
-
90
-
91
-
92
-
93
-
94
-
95
-
96
-
97
-
98
-
99
-
100
-
101
-
102
-
103
-
104
-
105
-
106
-
107
-
108
-
109
-
110
-
111
-
112
-
113
-
114
-
115
-
116
-
117
-
118
-
119
-
120
-
121
-
122
-
123
-
124
-
125
-
126
-
127
-
128
-
129
-
130
-
131
-
132
-
133
-
134
-
135
-
136
-
137
-
138
-
139
-
140
-
141
-
142
-
143
-
144
-
145
-
146
-
147
-
148
-
149
-
150
-
151
-
152
-
153
-
154
-
155
-
156
-
157
-
158
-
159
-
160
-
161
-
162
-
163
-
164
-
165
-
166
-
167
-
168
-
169
-
170
-
171
-
172
-
173
-
174
-
175
-
176
-
177
-
178
-
179
-
180
-
181
-
182
-
183
-
184
-
185
-
186
-
187
-
188
-
189
-
190
-
191
-
192
-
193
-
194
-
195
-
196
-
197
-
198
-
199
-
200
-
201
-
202
-
203
-
204
-
205
-
206
-
207
-
208
-
209
-
210
-
211
-
212
-
213
-
214
-
215
-
216
-
217
-
218
-
219
-
220
-
221
-
222
-
223
-
224
-
225
-
226
-
227
-
228
-
229
-
230
-
231
-
232
-
233
-
234
-
235
-
236
-
237
-
238
-
239
-
240
-
241
-
242
-
243
-
244
-
245
-
246
-
247
-
248
-
249
-
250
-
251
-
252
-
253
-
254
-
255
-
256
-
257
-
258
-
259
-
260
-
261
-
262
-
263
-
264
-
265
-
266
-
267
-
268
-
269
-
270
-
271
-
272
-
273
-
274
-
275
-
276
-
277
-
278
-
279
-
280
-
281
-
282
-
283
-
284
-
285
-
286
-
287
-
288
-
289
-
290
-
291
-
292
-
293
-
294
-
295
-
296
-
297
-
298
-
299
-
300
-
301
-
302
-
303
-
304
-
305
-
306
-
307
-
308
-
 309
309 -
 310
310 -
 311
311 -
 312
312 -
 313
313 -
 314
314 -
 315
315 -
 316
316 -
 317
317 -
 318
318 -
 319
319 -
 320
320 -
 321
321 -
 322
322 -
 323
323 -
 324
324 -
 325
325 -
 326
326 -
 327
327 -
 328
328 -
 329
329 -
330
-
331
-
332
-
333
-
334
-
335
-
336
-
337
-
338
-
339
-
340
-
341
-
342
-
343
-
344
-
345
-
346
-
347
-
348
-
349
-
350
-
351
-
352
-
353
-
354
-
355
-
356
-
357
-
358
-
359
-
360
-
361
-
362
-
363
-
364
-
365
-
366
-
367
-
368
-
369
-
370
-
371
-
372
-
373
-
374
-
375
-
376
-
377
-
378
-
379
-
380
-
381
-
382
-
383
-
384
-
385
-
386
-
387
-
388
-
389
-
390
-
391
-
392
-
393
-
394
-
395
-
396
-
397
-
398
-
399
-
400
-
401
-
402
-
403
-
404
-
405
-
406
-
407
-
408
-
409
-
410
-
411
-
412
-
413
-
414
-
415
-
416
-
417
-
418
-
419
-
420
-
421
-
422
-
423
-
424
-
425
-
426
-
427
-
428
-
429
-
430
-
431
-
432
-
433
-
434
-
435
-
436
-
437
-
438
-
439
-
440
 |
 |

317
Overview Operating & Financial Review Corporate Governance Financial Statements Shareholder Information
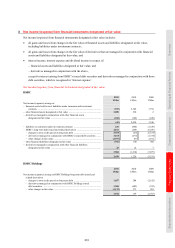
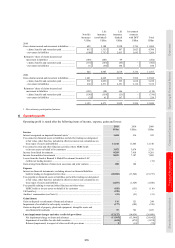
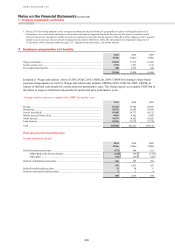
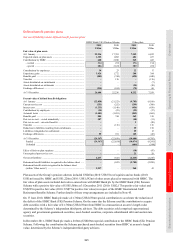
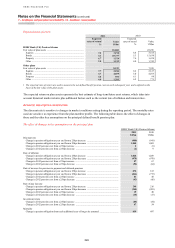
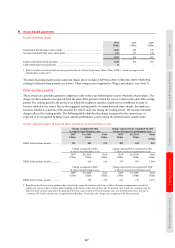
Net assets/(liabilities) recognised on balance sheet in respect of defined benefit plans
2011 2010
US$m US$m
Defined benefit pension plans .................................................................................................................. (208) (2,867)
HSBC Bank (UK) Pension Scheme ..................................................................................................... 2,237 (622)
– fair value of plan assets ................................................................................................................ 26,604 22,236
– present value of defined benefit obligations ................................................................................ (24,367) (22,858)
Other plans ........................................................................................................................................... (2,445) (2,245)
– fair value of plan assets ................................................................................................................ 8,232 7,559
– present value of defined benefit obligations ................................................................................ (10,680) (9,785)
– effect of limit on plan surpluses ................................................................................................... (18) (47)
– unrecognised past service cost ..................................................................................................... 21 28
Defined benefit healthcare plans .......................................................................................................... (961) (946)
– fair value of plan assets ................................................................................................................ 151 165
– present value of defined benefit obligations ................................................................................ (1,091) (1,087)
– unrecognised past service cost ..................................................................................................... (21) (24)
Fair value of plan assets ........................................................................................................................... 34,987 29,960
Present value of defined benefit obligations ............................................................................................ (36,138) (33,730)
Effect of limit on plan surpluses ............................................................................................................... (18) (47)
Unrecognised past service cost ................................................................................................................. – 4
(1,169) (3,813)
Retirement benefit liabilities .................................................................................................................... (3,666) (3,856)
Retirement benefit assets .......................................................................................................................... 2,497 43
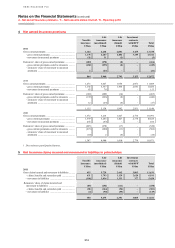
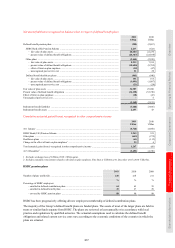
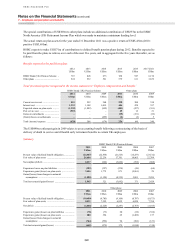
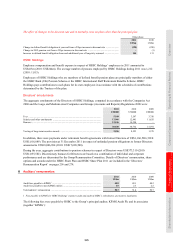
Cumulative actuarial gains/(losses) recognised in other comprehensive income
2011 2010
US$m US$m
At 1 January ............................................................................................................................................... (4,720) (4,660)
HSBC Bank (UK) Pension Scheme .......................................................................................................... 1,945 321
Other plans ................................................................................................................................................. (642) (275)
Healthcare plans ........................................................................................................................................ (61) (112)
Change in the effect of limit on plan surpluses1 ........................................................................................ 25 6
Total actuarial gains/(losses) recognised in other comprehensive income ............................................... 1,267 (60)
At 31 December2 ........................................................................................................................................ (3,453) (4,720)
1 Excludes exchange loss of US$4m (2010: US$6m gain).
2 Includes cumulative movements related to the limit on plan surpluses. This limit is US$18m at 31 December 2011 (2010: US$47m).
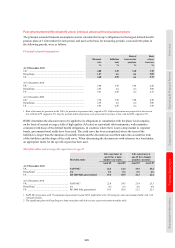
HSBC pension plans
2011 2010 2009
Number of plans worldwide ........................................................................................ 230 218 211
% % %
Percentage of HSBC employees:
– enrolled in defined contribution plans ............................................................ 64 63 59
– enrolled in defined benefit plans ..................................................................... 25 27 29
– covered by HSBC pension plans .................................................................... 89 90 88
HSBC has been progressively offering all new employees membership of defined contribution plans.
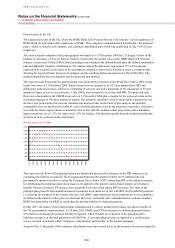
The majority of the Group’s defined benefit plans are funded plans. The assets of most of the larger plans are held in
trusts or similar funds separate from HSBC. The plans are reviewed at least annually or in accordance with local
practice and regulations by qualified actuaries. The actuarial assumptions used to calculate the defined benefit
obligations and related current service costs vary according to the economic conditions of the countries in which the
plans are situated.