HSBC 2011 Annual Report Download - page 316
Download and view the complete annual report
Please find page 316 of the 2011 HSBC annual report below. You can navigate through the pages in the report by either clicking on the pages listed below, or by using the keyword search tool below to find specific information within the annual report.-
 1
1 -
2
-
3
-
4
-
5
-
6
-
7
-
8
-
9
-
10
-
11
-
12
-
13
-
14
-
15
-
16
-
17
-
18
-
19
-
20
-
21
-
22
-
23
-
24
-
25
-
26
-
27
-
28
-
29
-
30
-
31
-
32
-
33
-
34
-
35
-
36
-
37
-
38
-
39
-
40
-
41
-
42
-
43
-
44
-
45
-
46
-
47
-
48
-
49
-
50
-
51
-
52
-
53
-
54
-
55
-
56
-
57
-
58
-
59
-
60
-
61
-
62
-
63
-
64
-
65
-
66
-
67
-
68
-
69
-
70
-
71
-
72
-
73
-
74
-
75
-
76
-
77
-
78
-
79
-
80
-
81
-
82
-
83
-
84
-
85
-
86
-
87
-
88
-
89
-
90
-
91
-
92
-
93
-
94
-
95
-
96
-
97
-
98
-
99
-
100
-
101
-
102
-
103
-
104
-
105
-
106
-
107
-
108
-
109
-
110
-
111
-
112
-
113
-
114
-
115
-
116
-
117
-
118
-
119
-
120
-
121
-
122
-
123
-
124
-
125
-
126
-
127
-
128
-
129
-
130
-
131
-
132
-
133
-
134
-
135
-
136
-
137
-
138
-
139
-
140
-
141
-
142
-
143
-
144
-
145
-
146
-
147
-
148
-
149
-
150
-
151
-
152
-
153
-
154
-
155
-
156
-
157
-
158
-
159
-
160
-
161
-
162
-
163
-
164
-
165
-
166
-
167
-
168
-
169
-
170
-
171
-
172
-
173
-
174
-
175
-
176
-
177
-
178
-
179
-
180
-
181
-
182
-
183
-
184
-
185
-
186
-
187
-
188
-
189
-
190
-
191
-
192
-
193
-
194
-
195
-
196
-
197
-
198
-
199
-
200
-
201
-
202
-
203
-
204
-
205
-
206
-
207
-
208
-
209
-
210
-
211
-
212
-
213
-
214
-
215
-
216
-
217
-
218
-
219
-
220
-
221
-
222
-
223
-
224
-
225
-
226
-
227
-
228
-
229
-
230
-
231
-
232
-
233
-
234
-
235
-
236
-
237
-
238
-
239
-
240
-
241
-
242
-
243
-
244
-
245
-
246
-
247
-
248
-
249
-
250
-
251
-
252
-
253
-
254
-
255
-
256
-
257
-
258
-
259
-
260
-
261
-
262
-
263
-
264
-
265
-
266
-
267
-
268
-
269
-
270
-
271
-
272
-
273
-
274
-
275
-
276
-
277
-
278
-
279
-
280
-
281
-
282
-
283
-
284
-
285
-
286
-
287
-
288
-
289
-
290
-
291
-
292
-
293
-
294
-
295
-
296
-
297
-
298
-
299
-
300
-
301
-
302
-
303
-
304
-
305
-
 306
306 -
 307
307 -
 308
308 -
 309
309 -
 310
310 -
 311
311 -
 312
312 -
 313
313 -
 314
314 -
 315
315 -
 316
316 -
 317
317 -
 318
318 -
 319
319 -
 320
320 -
 321
321 -
 322
322 -
 323
323 -
 324
324 -
 325
325 -
 326
326 -
327
-
328
-
329
-
330
-
331
-
332
-
333
-
334
-
335
-
336
-
337
-
338
-
339
-
340
-
341
-
342
-
343
-
344
-
345
-
346
-
347
-
348
-
349
-
350
-
351
-
352
-
353
-
354
-
355
-
356
-
357
-
358
-
359
-
360
-
361
-
362
-
363
-
364
-
365
-
366
-
367
-
368
-
369
-
370
-
371
-
372
-
373
-
374
-
375
-
376
-
377
-
378
-
379
-
380
-
381
-
382
-
383
-
384
-
385
-
386
-
387
-
388
-
389
-
390
-
391
-
392
-
393
-
394
-
395
-
396
-
397
-
398
-
399
-
400
-
401
-
402
-
403
-
404
-
405
-
406
-
407
-
408
-
409
-
410
-
411
-
412
-
413
-
414
-
415
-
416
-
417
-
418
-
419
-
420
-
421
-
422
-
423
-
424
-
425
-
426
-
427
-
428
-
429
-
430
-
431
-
432
-
433
-
434
-
435
-
436
-
437
-
438
-
439
-
440
 |
 |

HSBC HOLDINGS PLC
Notes on the Financial Statements (continued)
4 – Net earned insurance premiums / 5 – Net insurance claims incurred / 6 – Operating profit
314
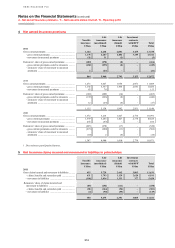
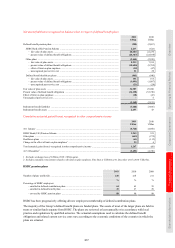
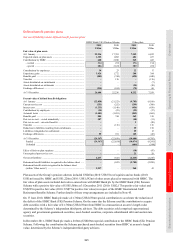
4 Net earned insurance premiums
Non-life
insurance
Life
insurance
(non-linked)
Life
insurance
(linked)
Investment
contracts
with DPF1 Total
US$m US$m US$m US$m US$m
2011
Gross earned premiums ................................................ 1,144 6,238 2,801 3,155 13,338
– gross written premiums ......................................... 1,175 6,207 2,804 3,155 13,341
– movement in unearned premiums ......................... (31) 31 (3) – (3)
Reinsurers’ share of gross earned premiums ................ (180) (278) (8) – (466)
– gross written premiums ceded to reinsurers .......... (182) (255) (8) – (445)
– reinsurers’ share of movement in unearned
premiums ............................................................... 2(23) – – (21)
964 5,960 2,793 3,155 12,872
2010
Gross earned premiums ................................................ 1,275 5,427 1,956 2,951 11,609
– gross written premiums ......................................... 1,192 5,357 1,956 2,951 11,456
– movement in unearned premiums ......................... 83 70 – – 153
Reinsurers’ share of gross earned premiums ................ (160) (289) (14) – (463)
– gross written premiums ceded to reinsurers .......... (172) (266) (8) – (446)
– reinsurers’ share of movement in unearned
premiums ............................................................... 12 (23) (6) – (17)
1,115 5,138 1,942 2,951 11,146
2009
Gross earned premiums ................................................ 1,572 5,218 1,427 2,774 10,991
– gross written premiums ......................................... 1,339 5,285 1,427 2,774 10,825
– movement in unearned premiums ......................... 233 (67) – – 166
Reinsurers’ share of gross earned premiums ................ (225) (278) (17) – (520)
– gross written premiums ceded to reinsurers .......... (215) (280) (11) – (506)
– reinsurers’ share of movement in unearned
premiums ............................................................... (10) 2 (6) – (14)
1,347 4,940 1,410 2,774 10,471
1 Discretionary participation features.
5 Net insurance claims incurred and movement in liabilities to policyholders
Non-life
insurance
Life
insurance
(non-linked)
Life
insurance
(linked)
Investment
contracts
with DPF1 Total
US$m US$m US$m US$m US$m
2011
Gross claims incurred and movement in liabilities ........... 435 5,729 2,462 3,005 11,631
– claims, benefits and surrenders paid ..................... 631 1,793 1,129 2,628 6,181
– movement in liabilities .......................................... (196) 3,936 1,333 377 5,450
Reinsurers’ share of claims incurred and
movement in liabilities ............................................ (85) (254) (111) – (450)
– claims, benefits and surrenders paid ..................... (81) (164) (56) – (301)
– movement in liabilities .......................................... (4) (90) (55) – (149)
350 5,475 2,351 3,005 11,181