HSBC 2011 Annual Report Download - page 90
Download and view the complete annual report
Please find page 90 of the 2011 HSBC annual report below. You can navigate through the pages in the report by either clicking on the pages listed below, or by using the keyword search tool below to find specific information within the annual report.-
 1
1 -
2
-
3
-
4
-
5
-
6
-
7
-
8
-
9
-
10
-
11
-
12
-
13
-
14
-
15
-
16
-
17
-
18
-
19
-
20
-
21
-
22
-
23
-
24
-
25
-
26
-
27
-
28
-
29
-
30
-
31
-
32
-
33
-
34
-
35
-
36
-
37
-
38
-
39
-
40
-
41
-
42
-
43
-
44
-
45
-
46
-
47
-
48
-
49
-
50
-
51
-
52
-
53
-
54
-
55
-
56
-
57
-
58
-
59
-
60
-
61
-
62
-
63
-
64
-
65
-
66
-
67
-
68
-
69
-
70
-
71
-
72
-
73
-
74
-
75
-
76
-
77
-
78
-
79
-
 80
80 -
 81
81 -
 82
82 -
 83
83 -
 84
84 -
 85
85 -
 86
86 -
 87
87 -
 88
88 -
 89
89 -
 90
90 -
 91
91 -
 92
92 -
 93
93 -
 94
94 -
 95
95 -
 96
96 -
 97
97 -
 98
98 -
 99
99 -
 100
100 -
101
-
102
-
103
-
104
-
105
-
106
-
107
-
108
-
109
-
110
-
111
-
112
-
113
-
114
-
115
-
116
-
117
-
118
-
119
-
120
-
121
-
122
-
123
-
124
-
125
-
126
-
127
-
128
-
129
-
130
-
131
-
132
-
133
-
134
-
135
-
136
-
137
-
138
-
139
-
140
-
141
-
142
-
143
-
144
-
145
-
146
-
147
-
148
-
149
-
150
-
151
-
152
-
153
-
154
-
155
-
156
-
157
-
158
-
159
-
160
-
161
-
162
-
163
-
164
-
165
-
166
-
167
-
168
-
169
-
170
-
171
-
172
-
173
-
174
-
175
-
176
-
177
-
178
-
179
-
180
-
181
-
182
-
183
-
184
-
185
-
186
-
187
-
188
-
189
-
190
-
191
-
192
-
193
-
194
-
195
-
196
-
197
-
198
-
199
-
200
-
201
-
202
-
203
-
204
-
205
-
206
-
207
-
208
-
209
-
210
-
211
-
212
-
213
-
214
-
215
-
216
-
217
-
218
-
219
-
220
-
221
-
222
-
223
-
224
-
225
-
226
-
227
-
228
-
229
-
230
-
231
-
232
-
233
-
234
-
235
-
236
-
237
-
238
-
239
-
240
-
241
-
242
-
243
-
244
-
245
-
246
-
247
-
248
-
249
-
250
-
251
-
252
-
253
-
254
-
255
-
256
-
257
-
258
-
259
-
260
-
261
-
262
-
263
-
264
-
265
-
266
-
267
-
268
-
269
-
270
-
271
-
272
-
273
-
274
-
275
-
276
-
277
-
278
-
279
-
280
-
281
-
282
-
283
-
284
-
285
-
286
-
287
-
288
-
289
-
290
-
291
-
292
-
293
-
294
-
295
-
296
-
297
-
298
-
299
-
300
-
301
-
302
-
303
-
304
-
305
-
306
-
307
-
308
-
309
-
310
-
311
-
312
-
313
-
314
-
315
-
316
-
317
-
318
-
319
-
320
-
321
-
322
-
323
-
324
-
325
-
326
-
327
-
328
-
329
-
330
-
331
-
332
-
333
-
334
-
335
-
336
-
337
-
338
-
339
-
340
-
341
-
342
-
343
-
344
-
345
-
346
-
347
-
348
-
349
-
350
-
351
-
352
-
353
-
354
-
355
-
356
-
357
-
358
-
359
-
360
-
361
-
362
-
363
-
364
-
365
-
366
-
367
-
368
-
369
-
370
-
371
-
372
-
373
-
374
-
375
-
376
-
377
-
378
-
379
-
380
-
381
-
382
-
383
-
384
-
385
-
386
-
387
-
388
-
389
-
390
-
391
-
392
-
393
-
394
-
395
-
396
-
397
-
398
-
399
-
400
-
401
-
402
-
403
-
404
-
405
-
406
-
407
-
408
-
409
-
410
-
411
-
412
-
413
-
414
-
415
-
416
-
417
-
418
-
419
-
420
-
421
-
422
-
423
-
424
-
425
-
426
-
427
-
428
-
429
-
430
-
431
-
432
-
433
-
434
-
435
-
436
-
437
-
438
-
439
-
440
 |
 |

HSBC HOLDINGS PLC
Report of the Directors: Operating and Financial Review (continued)
Geographical regions > North America / Latin America
88
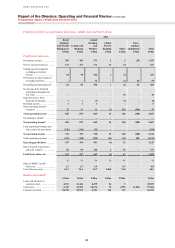
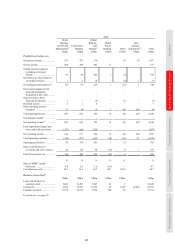
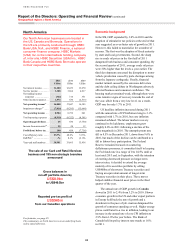
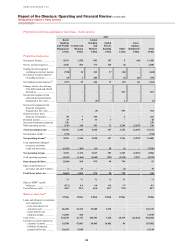
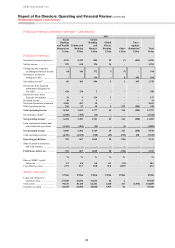
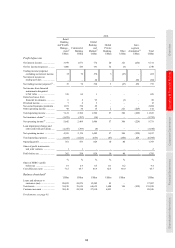
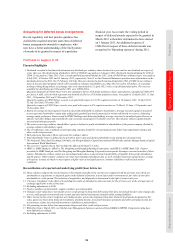
North America RBWM – profit/(loss) before tax and balance sheet data
2011 2010
Card and
Retail
Services
US$m
Run-off
portfolios
US$m
Rest of
RBWM
US$m
North
America
RBWM
US$m
Card and
Retail
Services
US$m
Run-off
portfolios
US$m
Rest of
RBWM
US$m
North
America
RBWM
US$m
Profit/(loss) before tax
Net interest income .................... 4,128 2,990 1,813 8,931 4,727 3,404 1,781 9,912
Net fee income/(expense) .......... 1,273 (49) 612 1,836 1,333 55 754 2,142
Trading income/(expense)
excluding net interest income – (1,145) 199 (946) – (377) (95) (472)
Net interest income on
trading activities .................... – –25 25 – – 24 24
Net trading income/(expense)56 .. – (1,145) 224 (921) – (377) (71) (448)
Changes in fair value of long-
term debt issued and related
derivatives ............................. – ––––– – –
Net income from other
financial instruments
designated at fair value .......... – ––––– 6 6
Net income from financial
instruments designated
at fair value ............................ – – – – – – 6 6
Gains less losses from
financial investments ............. – 55 3 58 – 5 – 5
Dividend income ........................ – 5 10 15 3 3 12 18
Net earned insurance premiums . – 230 6 236 – 236 9 245
Other operating income ............. 61 (185) (1) (125) 52 (253) (49) (250)
Total operating income ........... 5,462 1,901 2,667 10,030 6,115 3,073 2,442 11,630
Net insurance claims65 ............... – (156) 2 (154) – (152) 4 (148)
Net operating income52 ............ 5,462 1,745 2,669 9,876 6,115 2,921 2,446 11,482
Loan impairment charges and
other credit risk provisions .... (1,600) (4,982) (347) (6,929) (2,174) (5,811) (209) (8,194)
Net operating income/(expense) 3,862 (3,237) 2,322 2,947 3,941 (2,890) 2,237 3,288
Total operating expenses ........... (1,801) (1,238) (2,576) (5,615) (1,962) (1,190) (2,256) (5,408)
Operating profit/(loss) ............. 2,061 (4,475) (254) (2,668) 1,979 (4,080) (19) (2,120)
Share of profit in associates
and joint ventures .................. – 3 – 3 – 4 – 4
Profit/(loss) before tax ............. 2,061 (4,472) (254) (2,665) 1,979 (4,076) (19) (2,116)
% % % % % % % %
Share of HSBC’s profit
before tax ............................... 9.4 (20.4) (1.2) (12.2) 10.4 (21.4) (0.1) (11.1)
Cost efficiency ratio .................. 33.0 70.9 96.5 56.9 32.1 40.7 92.2 47.1
Balance sheet data49
US$m US$m US$m US$m US$m US$m US$m US$m
Loans and advances to customers
(net) reported in:
– loans and advances to
customers ........................... – 43,543 42,947 86,490 30,710 55,010 45,474 131,194
– assets held for sale
(disposal groups) ............... 29,137 – 1,921 31,058 – – – –
Total assets ................................ 30,635 56,830 56,813 144,278 32,044 70,587 51,573 154,204
Customer accounts reported in:
– customer accounts ............. – – 63,558 63,558 – – 76,817 76,817
– liabilities of disposal
groups held for sale ........... – – 10,104 10,104 – – – –
For footnotes, see page 95.