HSBC 2011 Annual Report Download - page 76
Download and view the complete annual report
Please find page 76 of the 2011 HSBC annual report below. You can navigate through the pages in the report by either clicking on the pages listed below, or by using the keyword search tool below to find specific information within the annual report.-
 1
1 -
2
-
3
-
4
-
5
-
6
-
7
-
8
-
9
-
10
-
11
-
12
-
13
-
14
-
15
-
16
-
17
-
18
-
19
-
20
-
21
-
22
-
23
-
24
-
25
-
26
-
27
-
28
-
29
-
30
-
31
-
32
-
33
-
34
-
35
-
36
-
37
-
38
-
39
-
40
-
41
-
42
-
43
-
44
-
45
-
46
-
47
-
48
-
49
-
50
-
51
-
52
-
53
-
54
-
55
-
56
-
57
-
58
-
59
-
60
-
61
-
62
-
63
-
64
-
65
-
 66
66 -
 67
67 -
 68
68 -
 69
69 -
 70
70 -
 71
71 -
 72
72 -
 73
73 -
 74
74 -
 75
75 -
 76
76 -
 77
77 -
 78
78 -
 79
79 -
 80
80 -
 81
81 -
 82
82 -
 83
83 -
 84
84 -
 85
85 -
 86
86 -
87
-
88
-
89
-
90
-
91
-
92
-
93
-
94
-
95
-
96
-
97
-
98
-
99
-
100
-
101
-
102
-
103
-
104
-
105
-
106
-
107
-
108
-
109
-
110
-
111
-
112
-
113
-
114
-
115
-
116
-
117
-
118
-
119
-
120
-
121
-
122
-
123
-
124
-
125
-
126
-
127
-
128
-
129
-
130
-
131
-
132
-
133
-
134
-
135
-
136
-
137
-
138
-
139
-
140
-
141
-
142
-
143
-
144
-
145
-
146
-
147
-
148
-
149
-
150
-
151
-
152
-
153
-
154
-
155
-
156
-
157
-
158
-
159
-
160
-
161
-
162
-
163
-
164
-
165
-
166
-
167
-
168
-
169
-
170
-
171
-
172
-
173
-
174
-
175
-
176
-
177
-
178
-
179
-
180
-
181
-
182
-
183
-
184
-
185
-
186
-
187
-
188
-
189
-
190
-
191
-
192
-
193
-
194
-
195
-
196
-
197
-
198
-
199
-
200
-
201
-
202
-
203
-
204
-
205
-
206
-
207
-
208
-
209
-
210
-
211
-
212
-
213
-
214
-
215
-
216
-
217
-
218
-
219
-
220
-
221
-
222
-
223
-
224
-
225
-
226
-
227
-
228
-
229
-
230
-
231
-
232
-
233
-
234
-
235
-
236
-
237
-
238
-
239
-
240
-
241
-
242
-
243
-
244
-
245
-
246
-
247
-
248
-
249
-
250
-
251
-
252
-
253
-
254
-
255
-
256
-
257
-
258
-
259
-
260
-
261
-
262
-
263
-
264
-
265
-
266
-
267
-
268
-
269
-
270
-
271
-
272
-
273
-
274
-
275
-
276
-
277
-
278
-
279
-
280
-
281
-
282
-
283
-
284
-
285
-
286
-
287
-
288
-
289
-
290
-
291
-
292
-
293
-
294
-
295
-
296
-
297
-
298
-
299
-
300
-
301
-
302
-
303
-
304
-
305
-
306
-
307
-
308
-
309
-
310
-
311
-
312
-
313
-
314
-
315
-
316
-
317
-
318
-
319
-
320
-
321
-
322
-
323
-
324
-
325
-
326
-
327
-
328
-
329
-
330
-
331
-
332
-
333
-
334
-
335
-
336
-
337
-
338
-
339
-
340
-
341
-
342
-
343
-
344
-
345
-
346
-
347
-
348
-
349
-
350
-
351
-
352
-
353
-
354
-
355
-
356
-
357
-
358
-
359
-
360
-
361
-
362
-
363
-
364
-
365
-
366
-
367
-
368
-
369
-
370
-
371
-
372
-
373
-
374
-
375
-
376
-
377
-
378
-
379
-
380
-
381
-
382
-
383
-
384
-
385
-
386
-
387
-
388
-
389
-
390
-
391
-
392
-
393
-
394
-
395
-
396
-
397
-
398
-
399
-
400
-
401
-
402
-
403
-
404
-
405
-
406
-
407
-
408
-
409
-
410
-
411
-
412
-
413
-
414
-
415
-
416
-
417
-
418
-
419
-
420
-
421
-
422
-
423
-
424
-
425
-
426
-
427
-
428
-
429
-
430
-
431
-
432
-
433
-
434
-
435
-
436
-
437
-
438
-
439
-
440
 |
 |

HSBC HOLDINGS PLC
Report of the Directors: Operating and Financial Review (continued)
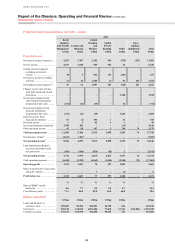
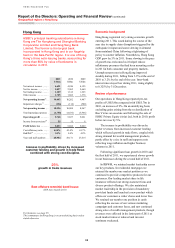
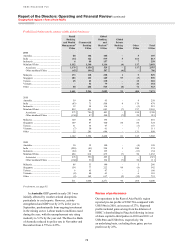
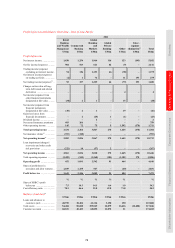
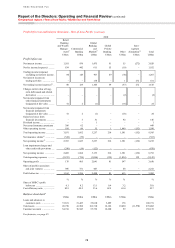
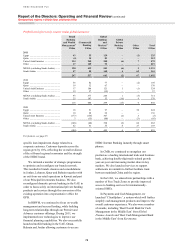
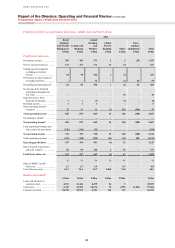
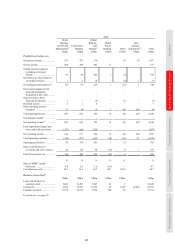
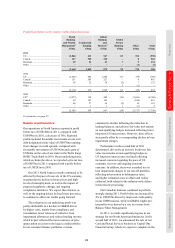
Geographical regions > Rest of Asia-Pacific
74
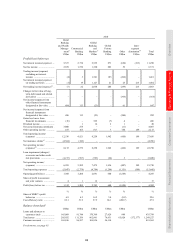
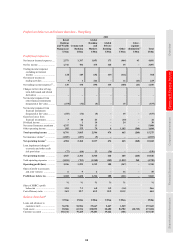
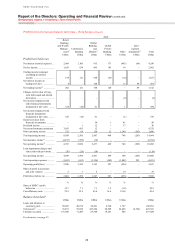
income of US$29m in 2010. This was due to
investment losses on assets held by the insurance
business, primarily in Singapore, as a result of
negative equity market movements during the
second half of 2011. To the extent that these
investment losses were attributed to policyholders of
unit-linked insurance policies and insurance
contracts with DPF, there was a corresponding
decrease in ‘Net insurance claims incurred and
movement in liabilities to policyholders’.
Losses from financial investments were US$23m
compared with gains of US$151m in 2010, due to an
impairment loss on an equity investment in 2011 in
GB&M, lower gains on the disposal of government
debt securities across the region and the non-
recurrence of a gain on disposal of an equity
investment in a Singaporean property company in
2010.
Net earned insurance premiums increased by
58% to US$759m as a result of successful sales
initiatives, most notably resulting in improved sales
of a universal life insurance product targeted at high
net worth individuals in Singapore. The growth in
premiums resulted in a corresponding increase in
‘Net insurance claims incurred and movement in
liabilities to policyholders’.
Other operating income increased by US$92m,
largely due to a rise in the PVIF asset in Singapore
as a result of higher life insurance sales and a net
increase from experience and assumption updates.
Loan impairment charges and other credit
risk provisions decreased by 42% to US$267m as a
result of the non-recurrence of a number of
individual loan impairment charges in GB&M on a
small number of accounts, coupled with the ongoing
reduction of unsecured lending portfolios in India.
We remain cautious on the outlook for credit quality
and sustained our focus on maintaining high levels
of underwriting and asset quality.
Operating expenses increased by 8% due to
wage inflation which reflected the competitive
labour market, along with an increase in average
staff numbers, notably in mainland China. Increased
business volumes across the region led to higher
support costs. Premises and equipment costs also
rose in certain countries, reflecting increased rental
expenses resulting from lease renewals and new
branch openings.
Share of profit from associates and joint ventures
increased by 22%. The contribution from BoCom
rose, driven by strong loan growth, wider deposit
spreads following interest rate increases in mainland
China and higher fee income, notably from
investment banking, settlements and cards. Income
from Industrial Bank also increased as a result of
strong growth in customer lending, a rise in fee-
based revenue and a fall in loan impairment charges.
Higher profits from Ping An resulted from strong
growth in sales in the insurance business and
increased income from the banking business
following the acquisition of Shenzhen Development
Bank in July 2011.