HSBC 2011 Annual Report Download - page 160
Download and view the complete annual report
Please find page 160 of the 2011 HSBC annual report below. You can navigate through the pages in the report by either clicking on the pages listed below, or by using the keyword search tool below to find specific information within the annual report.-
 1
1 -
2
-
3
-
4
-
5
-
6
-
7
-
8
-
9
-
10
-
11
-
12
-
13
-
14
-
15
-
16
-
17
-
18
-
19
-
20
-
21
-
22
-
23
-
24
-
25
-
26
-
27
-
28
-
29
-
30
-
31
-
32
-
33
-
34
-
35
-
36
-
37
-
38
-
39
-
40
-
41
-
42
-
43
-
44
-
45
-
46
-
47
-
48
-
49
-
50
-
51
-
52
-
53
-
54
-
55
-
56
-
57
-
58
-
59
-
60
-
61
-
62
-
63
-
64
-
65
-
66
-
67
-
68
-
69
-
70
-
71
-
72
-
73
-
74
-
75
-
76
-
77
-
78
-
79
-
80
-
81
-
82
-
83
-
84
-
85
-
86
-
87
-
88
-
89
-
90
-
91
-
92
-
93
-
94
-
95
-
96
-
97
-
98
-
99
-
100
-
101
-
102
-
103
-
104
-
105
-
106
-
107
-
108
-
109
-
110
-
111
-
112
-
113
-
114
-
115
-
116
-
117
-
118
-
119
-
120
-
121
-
122
-
123
-
124
-
125
-
126
-
127
-
128
-
129
-
130
-
131
-
132
-
133
-
134
-
135
-
136
-
137
-
138
-
139
-
140
-
141
-
142
-
143
-
144
-
145
-
146
-
147
-
148
-
149
-
 150
150 -
 151
151 -
 152
152 -
 153
153 -
 154
154 -
 155
155 -
 156
156 -
 157
157 -
 158
158 -
 159
159 -
 160
160 -
 161
161 -
 162
162 -
 163
163 -
 164
164 -
 165
165 -
 166
166 -
 167
167 -
 168
168 -
 169
169 -
 170
170 -
171
-
172
-
173
-
174
-
175
-
176
-
177
-
178
-
179
-
180
-
181
-
182
-
183
-
184
-
185
-
186
-
187
-
188
-
189
-
190
-
191
-
192
-
193
-
194
-
195
-
196
-
197
-
198
-
199
-
200
-
201
-
202
-
203
-
204
-
205
-
206
-
207
-
208
-
209
-
210
-
211
-
212
-
213
-
214
-
215
-
216
-
217
-
218
-
219
-
220
-
221
-
222
-
223
-
224
-
225
-
226
-
227
-
228
-
229
-
230
-
231
-
232
-
233
-
234
-
235
-
236
-
237
-
238
-
239
-
240
-
241
-
242
-
243
-
244
-
245
-
246
-
247
-
248
-
249
-
250
-
251
-
252
-
253
-
254
-
255
-
256
-
257
-
258
-
259
-
260
-
261
-
262
-
263
-
264
-
265
-
266
-
267
-
268
-
269
-
270
-
271
-
272
-
273
-
274
-
275
-
276
-
277
-
278
-
279
-
280
-
281
-
282
-
283
-
284
-
285
-
286
-
287
-
288
-
289
-
290
-
291
-
292
-
293
-
294
-
295
-
296
-
297
-
298
-
299
-
300
-
301
-
302
-
303
-
304
-
305
-
306
-
307
-
308
-
309
-
310
-
311
-
312
-
313
-
314
-
315
-
316
-
317
-
318
-
319
-
320
-
321
-
322
-
323
-
324
-
325
-
326
-
327
-
328
-
329
-
330
-
331
-
332
-
333
-
334
-
335
-
336
-
337
-
338
-
339
-
340
-
341
-
342
-
343
-
344
-
345
-
346
-
347
-
348
-
349
-
350
-
351
-
352
-
353
-
354
-
355
-
356
-
357
-
358
-
359
-
360
-
361
-
362
-
363
-
364
-
365
-
366
-
367
-
368
-
369
-
370
-
371
-
372
-
373
-
374
-
375
-
376
-
377
-
378
-
379
-
380
-
381
-
382
-
383
-
384
-
385
-
386
-
387
-
388
-
389
-
390
-
391
-
392
-
393
-
394
-
395
-
396
-
397
-
398
-
399
-
400
-
401
-
402
-
403
-
404
-
405
-
406
-
407
-
408
-
409
-
410
-
411
-
412
-
413
-
414
-
415
-
416
-
417
-
418
-
419
-
420
-
421
-
422
-
423
-
424
-
425
-
426
-
427
-
428
-
429
-
430
-
431
-
432
-
433
-
434
-
435
-
436
-
437
-
438
-
439
-
440
 |
 |

HSBC HOLDINGS PLC
Report of the Directors: Operating and Financial Review (continued)
Risk > Liquidity and funding > In 2011 / Contractual maturity of financial liabilities / Management of risk
158
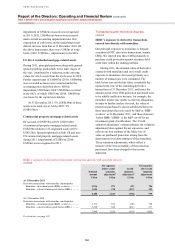
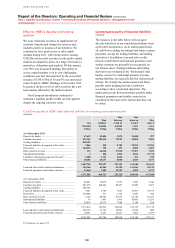
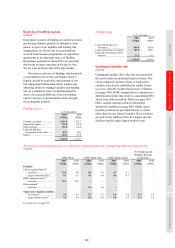
Effect on HSBC’s liquidity and funding
position
We issue wholesale securities to supplement our
customer deposits and change the currency mix,
maturity profile or location of our liabilities. We
continued to have good access to debt capital
markets during 2011, with Group entities issuing
US$22bn of term debt securities in the public capital
markets at competitive prices in a range of currencies,
maturities, obligations and markets. Of this amount,
over 90% was unsecured funding. Our ability to
access capital markets even in very challenging
conditions was best demonstrated by the successful
issuance of US$1.65bn of 10 and 30 year unsecured
senior bonds by HSBC Holdings in November 2011.
In general, the prices of our debt securities have not
been unduly affected by the market turmoil.
Our European subsidiaries continued to
maintain a liquidity profile within our risk appetite
despite the ongoing eurozone crisis.
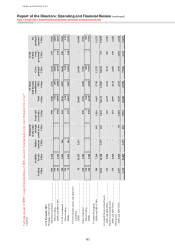
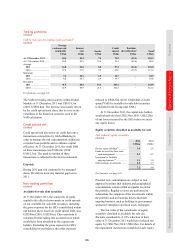
Contractual maturity of financial liabilities
(Audited)
The balances in the table below will not agree
directly with those in our consolidated balance sheet
as the table incorporates, on an undiscounted basis,
all cash flows relating to principal and future coupon
payments (except for trading liabilities and trading
derivatives). In addition, loan and other credit-
related commitments and financial guarantees and
similar contracts are generally not recognised on
our balance sheet. Trading liabilities and trading
derivatives are included in the ‘On demand’ time
bucket, and not by contractual maturity, because
trading liabilities are typically held for short periods
of time. We classify the undiscounted cash flows
payable under hedging derivative liabilities
according to their contractual maturities. The
undiscounted cash flows potentially payable under
financial guarantees and similar contracts are
classified on the basis of the earliest date they can
be called.
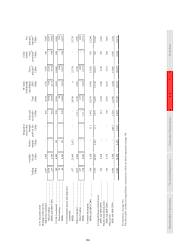
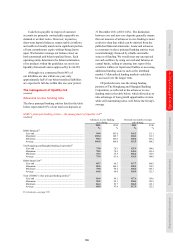
Cash flows payable by HSBC under financial liabilities by remaining contractual maturities
(Audited)
On
demand
US$m
Due
within 3
months
US$m
Due
between
3 and 12
months
US$m
Due
between
1 and 5
years
US$m
Due
after 5
years
US$m
At 31 December 2011
Deposits by banks ......................................................... 47,659 59,096 3,578 11,048 997
Customer accounts ........................................................ 914,762 252,226 72,993 20,508 1,094
Trading liabilities .......................................................... 265,192 – – – –
Financial liabilities designated at fair value ................. 7,066 930 9,789 39,915 57,295
Derivatives .................................................................... 340,394 394 497 2,858 1,007
Debt securities in issue ................................................. 117 48,465 27,520 57,507 7,019
Subordinated liabilities ................................................. 6 528 1,834 9,616 47,715
Liabilities of disposal groups held for sale43 ................ 3,108 1,721 1,045 211 150
Other financial liabilities .............................................. 25,452 28,137 5,845 2,023 1,377
1,603,756 391,497 123,101 143,686 116,654
Loan and other credit-related commitments ................ 355,366 65,245 94,120 111,061 29,113
Financial guarantees and similar contracts .................. 12,460 7,585 12,107 5,899 1,273
1,971,582 464,327 229,328 260,646 147,040
At 31 December 2010
Deposits by banks ......................................................... 42,481 70,072 8,393 7,949 1,346
Customer accounts ........................................................ 881,575 244,501 89,557 23,209 3,483
Trading liabilities .......................................................... 300,703 – – – –
Financial liabilities designated at fair value ................. 7,421 3,786 7,825 35,583 61,575
Derivatives .................................................................... 255,046 531 1,143 2,065 942
Debt securities in issue ................................................. 1,320 48,062 41,939 62,148 16,255
Subordinated liabilities ................................................. 34 1,491 1,863 10,001 51,293
Other financial liabilities .............................................. 24,834 24,378 7,944 2,184 824
1,513,414 392,821 158,664 143,139 135,718
Loan and other credit-related commitments ................ 524,394 51,732 14,023 11,964 400
Financial guarantees and similar contracts .................. 18,491 9,233 12,231 7,082 2,399
2,056,299 453,786 184,918 162,185 138,517
For footnote, see page 185.