HSBC 2011 Annual Report Download - page 287
Download and view the complete annual report
Please find page 287 of the 2011 HSBC annual report below. You can navigate through the pages in the report by either clicking on the pages listed below, or by using the keyword search tool below to find specific information within the annual report.-
 1
1 -
2
-
3
-
4
-
5
-
6
-
7
-
8
-
9
-
10
-
11
-
12
-
13
-
14
-
15
-
16
-
17
-
18
-
19
-
20
-
21
-
22
-
23
-
24
-
25
-
26
-
27
-
28
-
29
-
30
-
31
-
32
-
33
-
34
-
35
-
36
-
37
-
38
-
39
-
40
-
41
-
42
-
43
-
44
-
45
-
46
-
47
-
48
-
49
-
50
-
51
-
52
-
53
-
54
-
55
-
56
-
57
-
58
-
59
-
60
-
61
-
62
-
63
-
64
-
65
-
66
-
67
-
68
-
69
-
70
-
71
-
72
-
73
-
74
-
75
-
76
-
77
-
78
-
79
-
80
-
81
-
82
-
83
-
84
-
85
-
86
-
87
-
88
-
89
-
90
-
91
-
92
-
93
-
94
-
95
-
96
-
97
-
98
-
99
-
100
-
101
-
102
-
103
-
104
-
105
-
106
-
107
-
108
-
109
-
110
-
111
-
112
-
113
-
114
-
115
-
116
-
117
-
118
-
119
-
120
-
121
-
122
-
123
-
124
-
125
-
126
-
127
-
128
-
129
-
130
-
131
-
132
-
133
-
134
-
135
-
136
-
137
-
138
-
139
-
140
-
141
-
142
-
143
-
144
-
145
-
146
-
147
-
148
-
149
-
150
-
151
-
152
-
153
-
154
-
155
-
156
-
157
-
158
-
159
-
160
-
161
-
162
-
163
-
164
-
165
-
166
-
167
-
168
-
169
-
170
-
171
-
172
-
173
-
174
-
175
-
176
-
177
-
178
-
179
-
180
-
181
-
182
-
183
-
184
-
185
-
186
-
187
-
188
-
189
-
190
-
191
-
192
-
193
-
194
-
195
-
196
-
197
-
198
-
199
-
200
-
201
-
202
-
203
-
204
-
205
-
206
-
207
-
208
-
209
-
210
-
211
-
212
-
213
-
214
-
215
-
216
-
217
-
218
-
219
-
220
-
221
-
222
-
223
-
224
-
225
-
226
-
227
-
228
-
229
-
230
-
231
-
232
-
233
-
234
-
235
-
236
-
237
-
238
-
239
-
240
-
241
-
242
-
243
-
244
-
245
-
246
-
247
-
248
-
249
-
250
-
251
-
252
-
253
-
254
-
255
-
256
-
257
-
258
-
259
-
260
-
261
-
262
-
263
-
264
-
265
-
266
-
267
-
268
-
269
-
270
-
271
-
272
-
273
-
274
-
275
-
276
-
 277
277 -
 278
278 -
 279
279 -
 280
280 -
 281
281 -
 282
282 -
 283
283 -
 284
284 -
 285
285 -
 286
286 -
 287
287 -
 288
288 -
 289
289 -
 290
290 -
 291
291 -
 292
292 -
 293
293 -
 294
294 -
 295
295 -
 296
296 -
 297
297 -
298
-
299
-
300
-
301
-
302
-
303
-
304
-
305
-
306
-
307
-
308
-
309
-
310
-
311
-
312
-
313
-
314
-
315
-
316
-
317
-
318
-
319
-
320
-
321
-
322
-
323
-
324
-
325
-
326
-
327
-
328
-
329
-
330
-
331
-
332
-
333
-
334
-
335
-
336
-
337
-
338
-
339
-
340
-
341
-
342
-
343
-
344
-
345
-
346
-
347
-
348
-
349
-
350
-
351
-
352
-
353
-
354
-
355
-
356
-
357
-
358
-
359
-
360
-
361
-
362
-
363
-
364
-
365
-
366
-
367
-
368
-
369
-
370
-
371
-
372
-
373
-
374
-
375
-
376
-
377
-
378
-
379
-
380
-
381
-
382
-
383
-
384
-
385
-
386
-
387
-
388
-
389
-
390
-
391
-
392
-
393
-
394
-
395
-
396
-
397
-
398
-
399
-
400
-
401
-
402
-
403
-
404
-
405
-
406
-
407
-
408
-
409
-
410
-
411
-
412
-
413
-
414
-
415
-
416
-
417
-
418
-
419
-
420
-
421
-
422
-
423
-
424
-
425
-
426
-
427
-
428
-
429
-
430
-
431
-
432
-
433
-
434
-
435
-
436
-
437
-
438
-
439
-
440
 |
 |

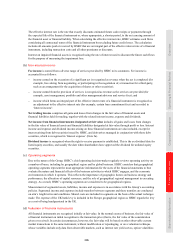
285
Shareholder Information Financial Statements Corporate Governance Operating & Financial Review Overview
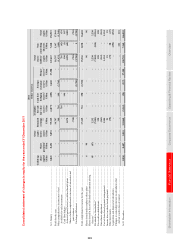
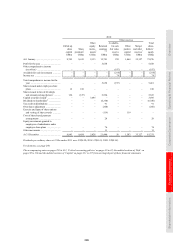
2009
Other reserves
Called up
share
capital
Share
premium2
Other
equity
instru-
ments
Retained
earnings
3,4,5
Available-
for-sale
fair value
reserve
Cash flow
hedging
reserve6
Foreign
exchange
reserve
Merger
reserve3,7
Total
share-
holders’
equity
Non-
controlling
interests
Total
equity
US$m US$m US$m US$m US$m US$m US$m US$m US$m US$m US$m
At 1 January .............................................................................. 6,053 8,463 2,133 82,684 (20,550) (806) (1,843) 17,457 93,591 6,638 100,229
Profit for the year ...................................................................... – – – 5,834 – – – – 5,834 860 6,694
Other comprehensive income (net of tax) ................................ – – – (2,536) 10,603 791 4,837 – 13,695 410 14,105
Available-for-sale investments ................................................. – – – – 10,603 – – – 10,603 214 10,817
Cash flow hedges ...................................................................... – – – – – 791 – – 791 (19) 772
Actuarial gains/(losses) on defined benefit plans .................... – – – (2,685) – – – – (2,685) 77 (2,608)
Share of other comprehensive income of associates and
joint ventures ........................................................................ – – – 149 – – – – 149 – 149
Exchange differences ............................................................... – – – – – – 4,837 – 4,837 138 4,975
Total comprehensive income for the year ................................ – – – 3,298 10,603 791 4,837 – 19,529 1,270 20,799
Shares issued under employee share plans .............................. 4 69 – – – – – – 73 – 73
Shares issued in lieu of dividends and amounts arising
thereon2 ................................................................................. 118 (119) – 1,670 – – – – 1,669 – 1,669
Shares issued in respect of rights issue7 ................................... 2,530 – – – – – – 15,796 18,326 – 18,326
Dividends to shareholders8 ....................................................... – – – (5,639) – – – – (5,639) (832) (6,471)
Tax credit on distributions ........................................................ – – – 50 – – – – 50 – 50
Own shares adjustment ............................................................. – – – (227) – – – – (227) – (227)
Exercise and lapse of share options and vesting of share
awards ................................................................................... – – – 38 – – – – 38 – 38
Cost of share-based payment arrangements ............................. – – – 683 – – – – 683 – 683
Income taxes on share-based payments ................................... – – – 9 – – – – 9 – 9
Other movements ...................................................................... – – – 226 (18) (11) – – 197 77 274
Transfers7 .................................................................................. – – – 5,945 – – – (5,945) – – –
Acquisition and disposal of subsidiaries ................................... – – – – – – – – – (38) (38)
Change in ownership interests in subsidiaries that
did not result in loss of control ............................................ – – – – – – – – – 247 247
At 31 December ........................................................................ 8,705 8,413 2,133 88,737 (9,965) (26) 2,994 27,308 128,299 7,362 135,661
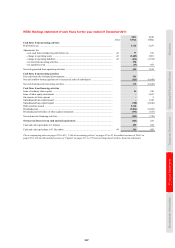
For footnotes, see page 290.
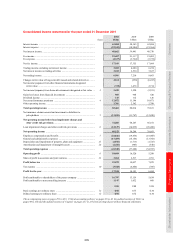
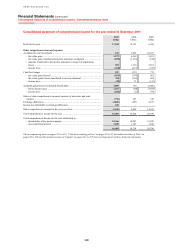
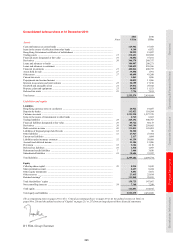
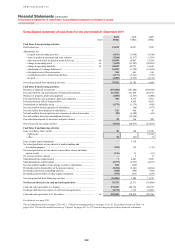
The accompanying notes on pages 291 to 413, ‘Critical accounting policies’ on pages 38 to 42, the audited sections of ‘Risk’ on pages 98 to 210 and the audited sections of ‘Capital’ on pages 211 to 217
form an integral part of these financial statements.