HSBC 2011 Annual Report Download - page 389
Download and view the complete annual report
Please find page 389 of the 2011 HSBC annual report below. You can navigate through the pages in the report by either clicking on the pages listed below, or by using the keyword search tool below to find specific information within the annual report.-
 1
1 -
2
-
3
-
4
-
5
-
6
-
7
-
8
-
9
-
10
-
11
-
12
-
13
-
14
-
15
-
16
-
17
-
18
-
19
-
20
-
21
-
22
-
23
-
24
-
25
-
26
-
27
-
28
-
29
-
30
-
31
-
32
-
33
-
34
-
35
-
36
-
37
-
38
-
39
-
40
-
41
-
42
-
43
-
44
-
45
-
46
-
47
-
48
-
49
-
50
-
51
-
52
-
53
-
54
-
55
-
56
-
57
-
58
-
59
-
60
-
61
-
62
-
63
-
64
-
65
-
66
-
67
-
68
-
69
-
70
-
71
-
72
-
73
-
74
-
75
-
76
-
77
-
78
-
79
-
80
-
81
-
82
-
83
-
84
-
85
-
86
-
87
-
88
-
89
-
90
-
91
-
92
-
93
-
94
-
95
-
96
-
97
-
98
-
99
-
100
-
101
-
102
-
103
-
104
-
105
-
106
-
107
-
108
-
109
-
110
-
111
-
112
-
113
-
114
-
115
-
116
-
117
-
118
-
119
-
120
-
121
-
122
-
123
-
124
-
125
-
126
-
127
-
128
-
129
-
130
-
131
-
132
-
133
-
134
-
135
-
136
-
137
-
138
-
139
-
140
-
141
-
142
-
143
-
144
-
145
-
146
-
147
-
148
-
149
-
150
-
151
-
152
-
153
-
154
-
155
-
156
-
157
-
158
-
159
-
160
-
161
-
162
-
163
-
164
-
165
-
166
-
167
-
168
-
169
-
170
-
171
-
172
-
173
-
174
-
175
-
176
-
177
-
178
-
179
-
180
-
181
-
182
-
183
-
184
-
185
-
186
-
187
-
188
-
189
-
190
-
191
-
192
-
193
-
194
-
195
-
196
-
197
-
198
-
199
-
200
-
201
-
202
-
203
-
204
-
205
-
206
-
207
-
208
-
209
-
210
-
211
-
212
-
213
-
214
-
215
-
216
-
217
-
218
-
219
-
220
-
221
-
222
-
223
-
224
-
225
-
226
-
227
-
228
-
229
-
230
-
231
-
232
-
233
-
234
-
235
-
236
-
237
-
238
-
239
-
240
-
241
-
242
-
243
-
244
-
245
-
246
-
247
-
248
-
249
-
250
-
251
-
252
-
253
-
254
-
255
-
256
-
257
-
258
-
259
-
260
-
261
-
262
-
263
-
264
-
265
-
266
-
267
-
268
-
269
-
270
-
271
-
272
-
273
-
274
-
275
-
276
-
277
-
278
-
279
-
280
-
281
-
282
-
283
-
284
-
285
-
286
-
287
-
288
-
289
-
290
-
291
-
292
-
293
-
294
-
295
-
296
-
297
-
298
-
299
-
300
-
301
-
302
-
303
-
304
-
305
-
306
-
307
-
308
-
309
-
310
-
311
-
312
-
313
-
314
-
315
-
316
-
317
-
318
-
319
-
320
-
321
-
322
-
323
-
324
-
325
-
326
-
327
-
328
-
329
-
330
-
331
-
332
-
333
-
334
-
335
-
336
-
337
-
338
-
339
-
340
-
341
-
342
-
343
-
344
-
345
-
346
-
347
-
348
-
349
-
350
-
351
-
352
-
353
-
354
-
355
-
356
-
357
-
358
-
359
-
360
-
361
-
362
-
363
-
364
-
365
-
366
-
367
-
368
-
369
-
370
-
371
-
372
-
373
-
374
-
375
-
376
-
377
-
378
-
 379
379 -
 380
380 -
 381
381 -
 382
382 -
 383
383 -
 384
384 -
 385
385 -
 386
386 -
 387
387 -
 388
388 -
 389
389 -
 390
390 -
 391
391 -
 392
392 -
 393
393 -
 394
394 -
 395
395 -
 396
396 -
 397
397 -
 398
398 -
 399
399 -
400
-
401
-
402
-
403
-
404
-
405
-
406
-
407
-
408
-
409
-
410
-
411
-
412
-
413
-
414
-
415
-
416
-
417
-
418
-
419
-
420
-
421
-
422
-
423
-
424
-
425
-
426
-
427
-
428
-
429
-
430
-
431
-
432
-
433
-
434
-
435
-
436
-
437
-
438
-
439
-
440
 |
 |

387
Overview Operating & Financial Review Corporate Governance Financial Statements Shareholder Information
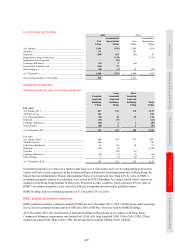
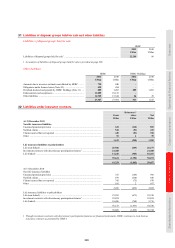
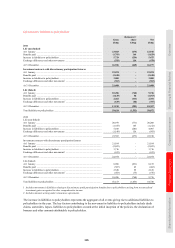
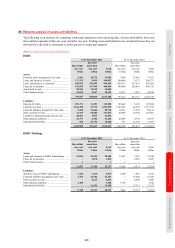
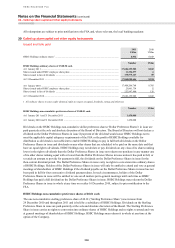
34 Subordinated liabilities
HSBC
2011 2010
US$m US$m
Subordinated liabilities
At amortised cost .................................................................................................................................. 30,606 33,387
– subordinated liabilities ..................................................................................................................... 25,543 28,309
– preferred securities ........................................................................................................................... 5,063 5,078
Designated at fair value (Note 29) ....................................................................................................... 21,611 23,815
– subordinated liabilities ..................................................................................................................... 17,503 19,395
– preferred securities ........................................................................................................................... 4,108 4,420
52,217 57,202
Subordinated liabilities
HSBC Holdings .................................................................................................................................... 21,456 22,878
Other HSBC ......................................................................................................................................... 30,761 34,324
52,217 57,202
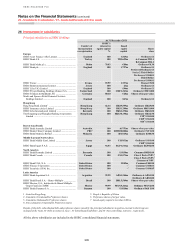
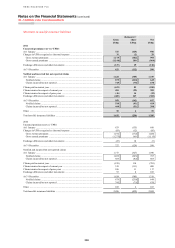
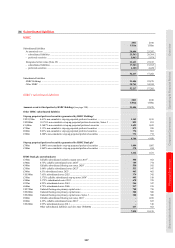
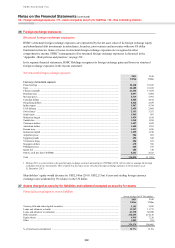
HSBC’s subordinated liabilities
2011 2010
US$m US$m
Amounts owed to third parties by HSBC Holdings (see page 390) .................................................... 21,456 22,878
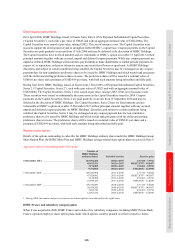
Other HSBC subordinated liabilities
Step-up perpetual preferred securities guaranteed by HSBC Holdings1
US$1,250m 4.61% non-cumulative step-up perpetual preferred securities .................................... 1,163 1,185
US$900m 10.176% non-cumulative step-up perpetual preferred securities, Series 2 ................. 891 891
€1,400m 5.3687% non-cumulative step-up perpetual preferred securities ................................ 1,693 1,843
€750m 5.13% non-cumulative step-up perpetual preferred securities .................................... 872 958
€600m 8.03% non-cumulative step-up perpetual preferred securities .................................... 776 801
£500m 8.208% non-cumulative step-up perpetual preferred securities .................................. 771 772
6,166 6,450
Step-up perpetual preferred securities guaranteed by HSBC Bank plc2
£700m 5.844% non-cumulative step-up perpetual preferred securities .................................. 1,084 1,087
£300m 5.862% non-cumulative step-up perpetual preferred securities .................................. 378 434
1,462 1,521
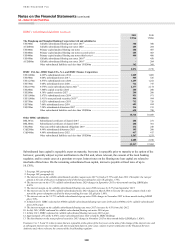
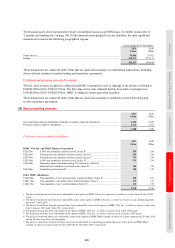
HSBC Bank plc and subsidiaries
£350m Callable subordinated variable coupon notes 20173 .................................................... 550 562
£500m 4.75% callable subordinated notes 20204 .................................................................... 759 774
€500m Callable subordinated floating rate notes 20205 .......................................................... 550 592
£350m 5.00% callable subordinated notes 20236 .................................................................... 533 547
£300m 6.5% subordinated notes 2023 ..................................................................................... 463 462
US$300m 7.65% subordinated notes 2025 ................................................................................... 374 342
£350m 5.375% callable subordinated step-up notes 20307 ..................................................... 493 510
£500m 5.375% subordinated notes 2033 ................................................................................. 678 729
£225m 6.25% subordinated notes 2041 ................................................................................... 346 347
£600m 4.75% subordinated notes 2046 ................................................................................... 917 919
US$750m Undated floating rate primary capital notes ................................................................. 750 750
US$500m Undated floating rate primary capital notes ................................................................. 500 500
US$300m Undated floating rate primary capital notes, Series 3 .................................................. 300 300
€800m Callable subordinated floating rate notes 20168 .......................................................... – 1,070
€600m 4.25% callable subordinated notes 20168 .................................................................... – 823
US$300m 6.95% subordinated notes 2011 ................................................................................... – 310
Other subordinated liabilities each less than US$200m .............................................. 617 662
7,830 10,199