HSBC 2011 Annual Report Download - page 146
Download and view the complete annual report
Please find page 146 of the 2011 HSBC annual report below. You can navigate through the pages in the report by either clicking on the pages listed below, or by using the keyword search tool below to find specific information within the annual report.-
 1
1 -
2
-
3
-
4
-
5
-
6
-
7
-
8
-
9
-
10
-
11
-
12
-
13
-
14
-
15
-
16
-
17
-
18
-
19
-
20
-
21
-
22
-
23
-
24
-
25
-
26
-
27
-
28
-
29
-
30
-
31
-
32
-
33
-
34
-
35
-
36
-
37
-
38
-
39
-
40
-
41
-
42
-
43
-
44
-
45
-
46
-
47
-
48
-
49
-
50
-
51
-
52
-
53
-
54
-
55
-
56
-
57
-
58
-
59
-
60
-
61
-
62
-
63
-
64
-
65
-
66
-
67
-
68
-
69
-
70
-
71
-
72
-
73
-
74
-
75
-
76
-
77
-
78
-
79
-
80
-
81
-
82
-
83
-
84
-
85
-
86
-
87
-
88
-
89
-
90
-
91
-
92
-
93
-
94
-
95
-
96
-
97
-
98
-
99
-
100
-
101
-
102
-
103
-
104
-
105
-
106
-
107
-
108
-
109
-
110
-
111
-
112
-
113
-
114
-
115
-
116
-
117
-
118
-
119
-
120
-
121
-
122
-
123
-
124
-
125
-
126
-
127
-
128
-
129
-
130
-
131
-
132
-
133
-
134
-
135
-
 136
136 -
 137
137 -
 138
138 -
 139
139 -
 140
140 -
 141
141 -
 142
142 -
 143
143 -
 144
144 -
 145
145 -
 146
146 -
 147
147 -
 148
148 -
 149
149 -
 150
150 -
 151
151 -
 152
152 -
 153
153 -
 154
154 -
 155
155 -
 156
156 -
157
-
158
-
159
-
160
-
161
-
162
-
163
-
164
-
165
-
166
-
167
-
168
-
169
-
170
-
171
-
172
-
173
-
174
-
175
-
176
-
177
-
178
-
179
-
180
-
181
-
182
-
183
-
184
-
185
-
186
-
187
-
188
-
189
-
190
-
191
-
192
-
193
-
194
-
195
-
196
-
197
-
198
-
199
-
200
-
201
-
202
-
203
-
204
-
205
-
206
-
207
-
208
-
209
-
210
-
211
-
212
-
213
-
214
-
215
-
216
-
217
-
218
-
219
-
220
-
221
-
222
-
223
-
224
-
225
-
226
-
227
-
228
-
229
-
230
-
231
-
232
-
233
-
234
-
235
-
236
-
237
-
238
-
239
-
240
-
241
-
242
-
243
-
244
-
245
-
246
-
247
-
248
-
249
-
250
-
251
-
252
-
253
-
254
-
255
-
256
-
257
-
258
-
259
-
260
-
261
-
262
-
263
-
264
-
265
-
266
-
267
-
268
-
269
-
270
-
271
-
272
-
273
-
274
-
275
-
276
-
277
-
278
-
279
-
280
-
281
-
282
-
283
-
284
-
285
-
286
-
287
-
288
-
289
-
290
-
291
-
292
-
293
-
294
-
295
-
296
-
297
-
298
-
299
-
300
-
301
-
302
-
303
-
304
-
305
-
306
-
307
-
308
-
309
-
310
-
311
-
312
-
313
-
314
-
315
-
316
-
317
-
318
-
319
-
320
-
321
-
322
-
323
-
324
-
325
-
326
-
327
-
328
-
329
-
330
-
331
-
332
-
333
-
334
-
335
-
336
-
337
-
338
-
339
-
340
-
341
-
342
-
343
-
344
-
345
-
346
-
347
-
348
-
349
-
350
-
351
-
352
-
353
-
354
-
355
-
356
-
357
-
358
-
359
-
360
-
361
-
362
-
363
-
364
-
365
-
366
-
367
-
368
-
369
-
370
-
371
-
372
-
373
-
374
-
375
-
376
-
377
-
378
-
379
-
380
-
381
-
382
-
383
-
384
-
385
-
386
-
387
-
388
-
389
-
390
-
391
-
392
-
393
-
394
-
395
-
396
-
397
-
398
-
399
-
400
-
401
-
402
-
403
-
404
-
405
-
406
-
407
-
408
-
409
-
410
-
411
-
412
-
413
-
414
-
415
-
416
-
417
-
418
-
419
-
420
-
421
-
422
-
423
-
424
-
425
-
426
-
427
-
428
-
429
-
430
-
431
-
432
-
433
-
434
-
435
-
436
-
437
-
438
-
439
-
440
 |
 |

HSBC HOLDINGS PLC
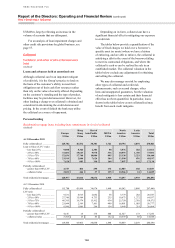
Report of the Directors: Operating and Financial Review (continued)
Risk > Credit risk > Collateral
144
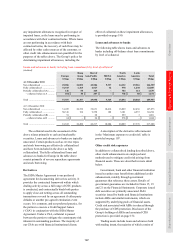
US$463m, largely reflecting an increase in the
volume of accounts that are delinquent.
For an analysis of loan impairment charges and
other credit risk provisions by global business, see
page 57.
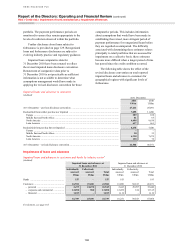
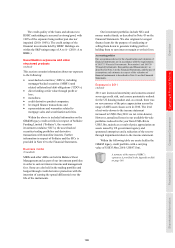
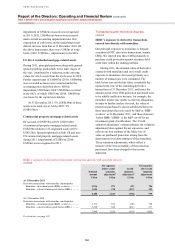
Collateral
Collateral and other credit enhancements
held
(Audited)
Loans and advances held at amortised cost
Although collateral can be an important mitigant
of credit risk, it is the Group’s practice to lend on
the basis of the customer’s ability to meet their
obligations out of their cash flow resources rather
than rely on the value of security offered. Depending
on the customer’s standing and the type of product,
facilities may be provided unsecured. However, for
other lending a charge over collateral is obtained and
considered in determining the credit decision and
pricing. In the event of default the bank may utilise
the collateral as a source of repayment.
Depending on its form, collateral can have a
significant financial effect in mitigating our exposure
to credit risk.
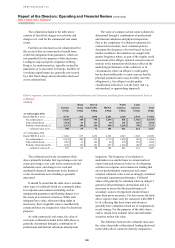
The tables below provide a quantification of the
value of fixed charges we hold over a borrower’s
specific asset (or assets) where we have a history
of enforcing, and are able to enforce, the collateral in
satisfying a debt in the event of the borrower failing
to meet its contractual obligations, and where the
collateral is cash or can be realised by sale in an
established market. The collateral valuation in the
tables below exclude any adjustments for obtaining
and selling the collateral.
We may also manage our risk by employing
other types of collateral and credit risk
enhancements, such as second charges, other
liens and unsupported guarantees, but the valuation
of such mitigants is less certain and their financial
effect has not been quantified. In particular, loans
shown in the tables below as not collateralised may
benefit from such credit mitigants.
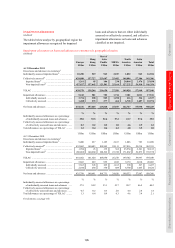
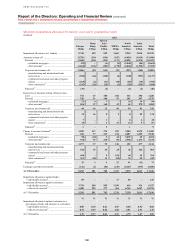
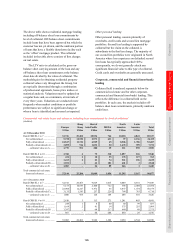
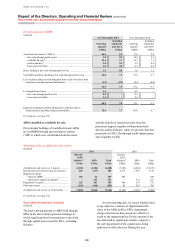
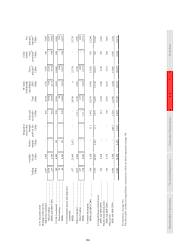
Personal lending
Residential mortgage loans including loan commitments by level of collateral
(Audited)
Europe
Hong
Kong
Rest of
Asia-Pacific MENA
North
America
Latin
America
Total
US$m US$m US$m US$m US$m US$m US$m
At 31 December 2011
Fully collateralised ..................... 125,702 46,532 38,381 1,761 60,794 4,891 278,061
Loan to Value (‘LTV’) ratio:
– less than 25% ....................... 9,898 5,364 2,383 58 3,576 282 21,561
– 25% to 50% ......................... 31,601 19,643 9,978 336 10,593 1,350 73,501
– 51% to 75% ......................... 52,656 17,748 18,006 895 25,138 2,221 116,664
– 76% to 90% ......................... 23,919 2,884 7,624 304 13,590 876 49,197
– 91% to 100% ....................... 7,628 893 390 168 7,897 162 17,138
Partially collateralised
– greater than 100% LTV ....... 3,275 484 295 174 12,503 102 16,833
– collateral value .................... 2,821 466 37 135 10,566 24 14,049
Total residential mortgages ......... 128,977 47,016 38,676 1,935 73,297 4,993 294,894
At 31 December 2010
Fully collateralised ..................... 115,700 43,948 34,674 1,490 66,542 5,086 267,440
LTV ratio:
– less than 25% ...................... 9,531 4,815 2,082 58 3,779 282 20,547
– 25% to 50% ......................... 27,740 15,984 8,733 235 10,973 1,272 64,937
– 51% to 75% ......................... 46,395 19,574 15,912 634 25,750 2,310 110,575
– 76% to 90% ......................... 23,044 2,569 7,661 409 16,091 1,003 50,777
– 91% to 100% ....................... 8,990 1,006 286 154 9,949 219 20,604
Partially collateralised
– greater than 100% LTV ....... 4,156 18 176 404 12,327 173 17,254
– collateral value .................... 3,705 15 45 152 10,539 88 14,544
Total residential mortgages ......... 119,856 43,966 34,850 1,894 78,869 5,259 284,694