HSBC 2011 Annual Report Download - page 339
Download and view the complete annual report
Please find page 339 of the 2011 HSBC annual report below. You can navigate through the pages in the report by either clicking on the pages listed below, or by using the keyword search tool below to find specific information within the annual report.-
 1
1 -
2
-
3
-
4
-
5
-
6
-
7
-
8
-
9
-
10
-
11
-
12
-
13
-
14
-
15
-
16
-
17
-
18
-
19
-
20
-
21
-
22
-
23
-
24
-
25
-
26
-
27
-
28
-
29
-
30
-
31
-
32
-
33
-
34
-
35
-
36
-
37
-
38
-
39
-
40
-
41
-
42
-
43
-
44
-
45
-
46
-
47
-
48
-
49
-
50
-
51
-
52
-
53
-
54
-
55
-
56
-
57
-
58
-
59
-
60
-
61
-
62
-
63
-
64
-
65
-
66
-
67
-
68
-
69
-
70
-
71
-
72
-
73
-
74
-
75
-
76
-
77
-
78
-
79
-
80
-
81
-
82
-
83
-
84
-
85
-
86
-
87
-
88
-
89
-
90
-
91
-
92
-
93
-
94
-
95
-
96
-
97
-
98
-
99
-
100
-
101
-
102
-
103
-
104
-
105
-
106
-
107
-
108
-
109
-
110
-
111
-
112
-
113
-
114
-
115
-
116
-
117
-
118
-
119
-
120
-
121
-
122
-
123
-
124
-
125
-
126
-
127
-
128
-
129
-
130
-
131
-
132
-
133
-
134
-
135
-
136
-
137
-
138
-
139
-
140
-
141
-
142
-
143
-
144
-
145
-
146
-
147
-
148
-
149
-
150
-
151
-
152
-
153
-
154
-
155
-
156
-
157
-
158
-
159
-
160
-
161
-
162
-
163
-
164
-
165
-
166
-
167
-
168
-
169
-
170
-
171
-
172
-
173
-
174
-
175
-
176
-
177
-
178
-
179
-
180
-
181
-
182
-
183
-
184
-
185
-
186
-
187
-
188
-
189
-
190
-
191
-
192
-
193
-
194
-
195
-
196
-
197
-
198
-
199
-
200
-
201
-
202
-
203
-
204
-
205
-
206
-
207
-
208
-
209
-
210
-
211
-
212
-
213
-
214
-
215
-
216
-
217
-
218
-
219
-
220
-
221
-
222
-
223
-
224
-
225
-
226
-
227
-
228
-
229
-
230
-
231
-
232
-
233
-
234
-
235
-
236
-
237
-
238
-
239
-
240
-
241
-
242
-
243
-
244
-
245
-
246
-
247
-
248
-
249
-
250
-
251
-
252
-
253
-
254
-
255
-
256
-
257
-
258
-
259
-
260
-
261
-
262
-
263
-
264
-
265
-
266
-
267
-
268
-
269
-
270
-
271
-
272
-
273
-
274
-
275
-
276
-
277
-
278
-
279
-
280
-
281
-
282
-
283
-
284
-
285
-
286
-
287
-
288
-
289
-
290
-
291
-
292
-
293
-
294
-
295
-
296
-
297
-
298
-
299
-
300
-
301
-
302
-
303
-
304
-
305
-
306
-
307
-
308
-
309
-
310
-
311
-
312
-
313
-
314
-
315
-
316
-
317
-
318
-
319
-
320
-
321
-
322
-
323
-
324
-
325
-
326
-
327
-
328
-
 329
329 -
 330
330 -
 331
331 -
 332
332 -
 333
333 -
 334
334 -
 335
335 -
 336
336 -
 337
337 -
 338
338 -
 339
339 -
 340
340 -
 341
341 -
 342
342 -
 343
343 -
 344
344 -
 345
345 -
 346
346 -
 347
347 -
 348
348 -
 349
349 -
350
-
351
-
352
-
353
-
354
-
355
-
356
-
357
-
358
-
359
-
360
-
361
-
362
-
363
-
364
-
365
-
366
-
367
-
368
-
369
-
370
-
371
-
372
-
373
-
374
-
375
-
376
-
377
-
378
-
379
-
380
-
381
-
382
-
383
-
384
-
385
-
386
-
387
-
388
-
389
-
390
-
391
-
392
-
393
-
394
-
395
-
396
-
397
-
398
-
399
-
400
-
401
-
402
-
403
-
404
-
405
-
406
-
407
-
408
-
409
-
410
-
411
-
412
-
413
-
414
-
415
-
416
-
417
-
418
-
419
-
420
-
421
-
422
-
423
-
424
-
425
-
426
-
427
-
428
-
429
-
430
-
431
-
432
-
433
-
434
-
435
-
436
-
437
-
438
-
439
-
440
 |
 |

337
Overview Operating & Financial Review Corporate Governance Financial Statements Shareholder Information
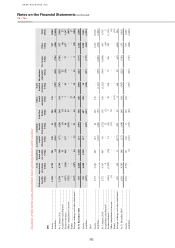
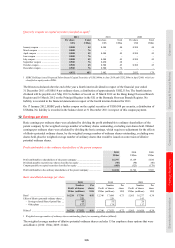
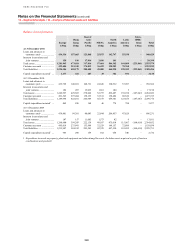
Profit/(loss) for the year
Europe
Hong
Kong
Rest of
Asia-
Pacific MENA
North
America
Latin
America
Intra-
HSBC
items
Total
US$m US$m US$m US$m US$m US$m US$m US$m
2011
Net interest income ............................... 11,001 4,691 5,102 1,432 11,480 6,956 – 40,662
Net fee income ...................................... 6,236 3,097 2,111 627 3,308 1,781 – 17,160
Net trading income/(expense) ............... 2,161 1,189 1,658 482 (362) 1,378 – 6,506
Other income ........................................ 4,848 1,705 1,842 66 1,574 1,338 (3,421) 7,952
Net operating income1 .......................... 24,246 10,682 10,713 2,607 16,000 11,453 (3,421) 72,280
Loan impairment charges and other
credit risk provisions ........................ (2,512) (156) (267) (293) (7,016) (1,883) – (12,127)
Net operating income ............................ 21,734 10,526 10,446 2,314 8,984 9,570 (3,421) 60,153
Employee compensation and benefits .. (7,621) (2,610) (3,179) (659) (3,928) (3,169) – (21,166)
General and administrative expenses ... (8,473) (1,724) (2,378) (458) (4,404) (3,443) 3,421 (17,459)
Depreciation and impairment of
property, plant and equipment .......... (581) (245) (198) (36) (261) (249) – (1,570)
Amortisation and impairment of
intangible assets ................................ (394) (179) (51) (6) (326) (394) – (1,350)
Total operating expenses ...................... (17,069) (4,758) (5,806) (1,159) (8,919) (7,255) 3,421 (41,545)
Operating profit .................................... 4,665 5,768 4,640 1,155 65 2,315 – 18,608
Share of profit in associates and joint
ventures ............................................ 6 55 2,831 337 35 – – 3,264
Profit before tax .................................... 4,671 5,823 7,471 1,492 100 2,315 – 21,872
Tax income/(expense) ........................... (1,589) (1,043) (1,315) (266) 958 (673) – (3,928)
Profit for the year .................................. 3,082 4,780 6,156 1,226 1,058 1,642 – 17,944
2010
Net interest income ............................... 11,250 4,246 3,828 1,367 12,439 6,311 – 39,441
Net fee income ...................................... 6,371 2,962 1,932 677 3,664 1,749 – 17,355
Net trading income ............................... 2,863 1,312 1,618 370 314 733 – 7,210
Other income/(expense) ........................ 2,266 1,682 1,854 (4) 630 938 (3,125) 4,241
Net operating income1 .......................... 22,750 10,202 9,232 2,410 17,047 9,731 (3,125) 68,247
Loan impairment charges and other
credit risk provisions ........................ (3,020) (114) (439) (627) (8,295) (1,544) – (14,039)
Net operating income ............................ 19,730 10,088 8,793 1,783 8,752 8,187 (3,125) 54,208
Employee compensation and benefits .. (7,875) (2,341) (2,719) (579) (3,672) (2,650) – (19,836)
General and administrative expenses ... (6,499) (1,686) (2,181) (450) (4,179) (3,286) 3,125 (15,156)
Depreciation and impairment of
property, plant and equipment .......... (719) (237) (189) (42) (288) (238) – (1,713)
Amortisation and impairment of
intangible assets ................................ (352) (167) (54) (7) (183) (220) – (983)
Total operating expenses ...................... (15,445) (4,431) (5,143) (1,078) (8,322) (6,394) 3,125 (37,688)
Operating profit .................................... 4,285 5,657 3,650 705 430 1,793 – 16,520
Share of profit in associates and joint
ventures ............................................ 17 35 2,252 187 24 2 – 2,517
Profit before tax .................................... 4,302 5,692 5,902 892 454 1,795 – 19,037
Tax expense .......................................... (1,006) (987) (962) (138) (1,180) (573) – (4,846)
Profit/(loss) for the year ........................ 3,296 4,705 4,940 754 (726) 1,222 – 14,191