HSBC 2011 Annual Report Download - page 375
Download and view the complete annual report
Please find page 375 of the 2011 HSBC annual report below. You can navigate through the pages in the report by either clicking on the pages listed below, or by using the keyword search tool below to find specific information within the annual report.-
 1
1 -
2
-
3
-
4
-
5
-
6
-
7
-
8
-
9
-
10
-
11
-
12
-
13
-
14
-
15
-
16
-
17
-
18
-
19
-
20
-
21
-
22
-
23
-
24
-
25
-
26
-
27
-
28
-
29
-
30
-
31
-
32
-
33
-
34
-
35
-
36
-
37
-
38
-
39
-
40
-
41
-
42
-
43
-
44
-
45
-
46
-
47
-
48
-
49
-
50
-
51
-
52
-
53
-
54
-
55
-
56
-
57
-
58
-
59
-
60
-
61
-
62
-
63
-
64
-
65
-
66
-
67
-
68
-
69
-
70
-
71
-
72
-
73
-
74
-
75
-
76
-
77
-
78
-
79
-
80
-
81
-
82
-
83
-
84
-
85
-
86
-
87
-
88
-
89
-
90
-
91
-
92
-
93
-
94
-
95
-
96
-
97
-
98
-
99
-
100
-
101
-
102
-
103
-
104
-
105
-
106
-
107
-
108
-
109
-
110
-
111
-
112
-
113
-
114
-
115
-
116
-
117
-
118
-
119
-
120
-
121
-
122
-
123
-
124
-
125
-
126
-
127
-
128
-
129
-
130
-
131
-
132
-
133
-
134
-
135
-
136
-
137
-
138
-
139
-
140
-
141
-
142
-
143
-
144
-
145
-
146
-
147
-
148
-
149
-
150
-
151
-
152
-
153
-
154
-
155
-
156
-
157
-
158
-
159
-
160
-
161
-
162
-
163
-
164
-
165
-
166
-
167
-
168
-
169
-
170
-
171
-
172
-
173
-
174
-
175
-
176
-
177
-
178
-
179
-
180
-
181
-
182
-
183
-
184
-
185
-
186
-
187
-
188
-
189
-
190
-
191
-
192
-
193
-
194
-
195
-
196
-
197
-
198
-
199
-
200
-
201
-
202
-
203
-
204
-
205
-
206
-
207
-
208
-
209
-
210
-
211
-
212
-
213
-
214
-
215
-
216
-
217
-
218
-
219
-
220
-
221
-
222
-
223
-
224
-
225
-
226
-
227
-
228
-
229
-
230
-
231
-
232
-
233
-
234
-
235
-
236
-
237
-
238
-
239
-
240
-
241
-
242
-
243
-
244
-
245
-
246
-
247
-
248
-
249
-
250
-
251
-
252
-
253
-
254
-
255
-
256
-
257
-
258
-
259
-
260
-
261
-
262
-
263
-
264
-
265
-
266
-
267
-
268
-
269
-
270
-
271
-
272
-
273
-
274
-
275
-
276
-
277
-
278
-
279
-
280
-
281
-
282
-
283
-
284
-
285
-
286
-
287
-
288
-
289
-
290
-
291
-
292
-
293
-
294
-
295
-
296
-
297
-
298
-
299
-
300
-
301
-
302
-
303
-
304
-
305
-
306
-
307
-
308
-
309
-
310
-
311
-
312
-
313
-
314
-
315
-
316
-
317
-
318
-
319
-
320
-
321
-
322
-
323
-
324
-
325
-
326
-
327
-
328
-
329
-
330
-
331
-
332
-
333
-
334
-
335
-
336
-
337
-
338
-
339
-
340
-
341
-
342
-
343
-
344
-
345
-
346
-
347
-
348
-
349
-
350
-
351
-
352
-
353
-
354
-
355
-
356
-
357
-
358
-
359
-
360
-
361
-
362
-
363
-
364
-
 365
365 -
 366
366 -
 367
367 -
 368
368 -
 369
369 -
 370
370 -
 371
371 -
 372
372 -
 373
373 -
 374
374 -
 375
375 -
 376
376 -
 377
377 -
 378
378 -
 379
379 -
 380
380 -
 381
381 -
 382
382 -
 383
383 -
 384
384 -
 385
385 -
386
-
387
-
388
-
389
-
390
-
391
-
392
-
393
-
394
-
395
-
396
-
397
-
398
-
399
-
400
-
401
-
402
-
403
-
404
-
405
-
406
-
407
-
408
-
409
-
410
-
411
-
412
-
413
-
414
-
415
-
416
-
417
-
418
-
419
-
420
-
421
-
422
-
423
-
424
-
425
-
426
-
427
-
428
-
429
-
430
-
431
-
432
-
433
-
434
-
435
-
436
-
437
-
438
-
439
-
440
 |
 |

373
Overview Operating & Financial Review Corporate Governance Financial Statements Shareholder Information
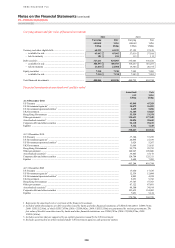
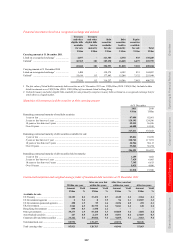
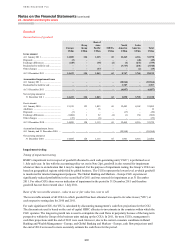
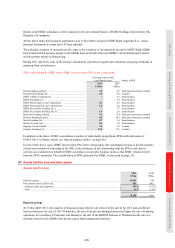
Key assumptions in VIU calculation and management’s approach to determining the values assigned to each key
assumption
2011 2010
Cash-generating unit
Goodwill at
1 July
2011
Discount
rate
Nominal
growth rate
beyond
initial
cash flow
projections
Goodwill at
1 July
2010
Discount
rate
Nominal
growth rate
beyond
initial
cash flow
projections
US$m % % US$m % %
Retail Banking and Wealth Management
– Europe ...................................................... 4,794 10.0 4.7 4,017 11.0 3.0
Commercial Banking – Europe ....................... 3,574 10.1 4.5 3,015 11.0 3.0
Global Private Banking – Europe .................... 4,456 10.0 4.3 4,055 11.0 3.0
Global Banking and Markets – Europe ........... 3,139 10.2 4.4 2,983 12.0 3.0
Retail Banking and Wealth Management
– Latin America ........................................... 2,537 16.0 9.3 2,385 14.3 8.6
Total goodwill in the CGUs listed above ........ 18,500 16,455
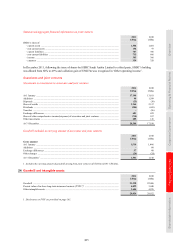
At 1 July 2011, aggregate goodwill of US$5,091m (1 July 2010: US$4,674m) had been allocated to CGUs that were
not considered individually significant. These CGUs do not carry on their balance sheets any significant intangible
assets with indefinite useful lives, other than goodwill.
Nominal long-term growth rate: this growth rate reflects GDP and inflation for the countries within which the CGU
operates. In 2010 these were based largely on external historical data. For 2011 the rates are based on IMF forecast
growth rates as these rates are regarded as a more relevant estimate of likely future trends. The rates used for 2010
and 2011 do not exceed the long-term growth rate for the countries within which the CGU operates.
Discount rate: the discount rate used to discount the cash flows is based on the cost of capital assigned to each CGU,
which is derived using a Capital Asset Pricing Model (‘CAPM’). The CAPM depends on inputs reflecting a number
of financial and economic variables including the risk-free rate and a premium to reflect the inherent risk of the
business being evaluated. These variables are based on the market’s assessment of the economic variables and
management’s judgement. In addition, for the purposes of testing goodwill for impairment, management supplements
this process by comparing the discount rates derived using the internally generated CAPM with cost of capital rates
produced by external sources. HSBC uses externally-sourced cost of capital rates where, in management’s judgement,
those rates reflect more accurately the current market and economic conditions. For 2011 and 2010, internal costs of
capital rates were consistent with externally-sourced rates. The decrease in European discount rates was largely
driven by deleveraging within the financial services sector including HSBC and a fall in the risk free rate.
Management’s judgement in estimating the cash flows of a CGU: the cash flow projections for each CGU are
based on plans approved by the Group Management Board. The key assumptions in addition to the discount rate and
nominal long-term growth rate for each significant CGU are discussed below.
Retail Banking and Wealth Management – Europe and Commercial Banking – Europe: the assumptions included in
the cash flow projections for Retail Banking and Wealth Management – Europe and Commercial Banking – Europe
reflect the economic environment and financial outlook of the European countries within these two segments. Key
assumptions include the level of interest rates and the level and change in unemployment rates. While current
economic conditions in Europe continue to be challenging, management’s cash flow projections are based primarily
on these prevailing conditions. Risks include a double-dip recession in the UK and the continuation of base rates at
their current low levels. Based on the conditions at the balance sheet date, management determined that a reasonably
possible change in any of the key assumptions described above would not cause an impairment to be recognised in
respect of Retail Banking and Wealth Management – Europe or Commercial Banking – Europe.
Global Private Banking – Europe: the revenues in Global Private Banking – Europe are predominately generated
through HSBC’s client relationships. The cash flow forecast reflects current economic conditions and key
assumptions include the level of interest rates and client risk appetite. Further economic deterioration could result
in a decrease in assets under management and a reduction in fee and trading income through increased client risk
aversion. Based on the conditions at the balance sheet date, management determined that a reasonably possible
change in any of the key assumptions described above would not cause an impairment to be recognised in respect of
Global Private Banking – Europe.