HSBC 2011 Annual Report Download - page 332
Download and view the complete annual report
Please find page 332 of the 2011 HSBC annual report below. You can navigate through the pages in the report by either clicking on the pages listed below, or by using the keyword search tool below to find specific information within the annual report.-
 1
1 -
2
-
3
-
4
-
5
-
6
-
7
-
8
-
9
-
10
-
11
-
12
-
13
-
14
-
15
-
16
-
17
-
18
-
19
-
20
-
21
-
22
-
23
-
24
-
25
-
26
-
27
-
28
-
29
-
30
-
31
-
32
-
33
-
34
-
35
-
36
-
37
-
38
-
39
-
40
-
41
-
42
-
43
-
44
-
45
-
46
-
47
-
48
-
49
-
50
-
51
-
52
-
53
-
54
-
55
-
56
-
57
-
58
-
59
-
60
-
61
-
62
-
63
-
64
-
65
-
66
-
67
-
68
-
69
-
70
-
71
-
72
-
73
-
74
-
75
-
76
-
77
-
78
-
79
-
80
-
81
-
82
-
83
-
84
-
85
-
86
-
87
-
88
-
89
-
90
-
91
-
92
-
93
-
94
-
95
-
96
-
97
-
98
-
99
-
100
-
101
-
102
-
103
-
104
-
105
-
106
-
107
-
108
-
109
-
110
-
111
-
112
-
113
-
114
-
115
-
116
-
117
-
118
-
119
-
120
-
121
-
122
-
123
-
124
-
125
-
126
-
127
-
128
-
129
-
130
-
131
-
132
-
133
-
134
-
135
-
136
-
137
-
138
-
139
-
140
-
141
-
142
-
143
-
144
-
145
-
146
-
147
-
148
-
149
-
150
-
151
-
152
-
153
-
154
-
155
-
156
-
157
-
158
-
159
-
160
-
161
-
162
-
163
-
164
-
165
-
166
-
167
-
168
-
169
-
170
-
171
-
172
-
173
-
174
-
175
-
176
-
177
-
178
-
179
-
180
-
181
-
182
-
183
-
184
-
185
-
186
-
187
-
188
-
189
-
190
-
191
-
192
-
193
-
194
-
195
-
196
-
197
-
198
-
199
-
200
-
201
-
202
-
203
-
204
-
205
-
206
-
207
-
208
-
209
-
210
-
211
-
212
-
213
-
214
-
215
-
216
-
217
-
218
-
219
-
220
-
221
-
222
-
223
-
224
-
225
-
226
-
227
-
228
-
229
-
230
-
231
-
232
-
233
-
234
-
235
-
236
-
237
-
238
-
239
-
240
-
241
-
242
-
243
-
244
-
245
-
246
-
247
-
248
-
249
-
250
-
251
-
252
-
253
-
254
-
255
-
256
-
257
-
258
-
259
-
260
-
261
-
262
-
263
-
264
-
265
-
266
-
267
-
268
-
269
-
270
-
271
-
272
-
273
-
274
-
275
-
276
-
277
-
278
-
279
-
280
-
281
-
282
-
283
-
284
-
285
-
286
-
287
-
288
-
289
-
290
-
291
-
292
-
293
-
294
-
295
-
296
-
297
-
298
-
299
-
300
-
301
-
302
-
303
-
304
-
305
-
306
-
307
-
308
-
309
-
310
-
311
-
312
-
313
-
314
-
315
-
316
-
317
-
318
-
319
-
320
-
321
-
 322
322 -
 323
323 -
 324
324 -
 325
325 -
 326
326 -
 327
327 -
 328
328 -
 329
329 -
 330
330 -
 331
331 -
 332
332 -
 333
333 -
 334
334 -
 335
335 -
 336
336 -
 337
337 -
 338
338 -
 339
339 -
 340
340 -
 341
341 -
 342
342 -
343
-
344
-
345
-
346
-
347
-
348
-
349
-
350
-
351
-
352
-
353
-
354
-
355
-
356
-
357
-
358
-
359
-
360
-
361
-
362
-
363
-
364
-
365
-
366
-
367
-
368
-
369
-
370
-
371
-
372
-
373
-
374
-
375
-
376
-
377
-
378
-
379
-
380
-
381
-
382
-
383
-
384
-
385
-
386
-
387
-
388
-
389
-
390
-
391
-
392
-
393
-
394
-
395
-
396
-
397
-
398
-
399
-
400
-
401
-
402
-
403
-
404
-
405
-
406
-
407
-
408
-
409
-
410
-
411
-
412
-
413
-
414
-
415
-
416
-
417
-
418
-
419
-
420
-
421
-
422
-
423
-
424
-
425
-
426
-
427
-
428
-
429
-
430
-
431
-
432
-
433
-
434
-
435
-
436
-
437
-
438
-
439
-
440
 |
 |

HSBC HOLDINGS PLC
Notes on the Financial Statements (continued)
9 – Share-based payments / 10 – Tax
330
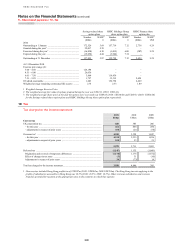
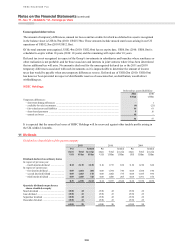
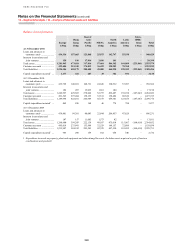
Savings-related share
option plans
HSBC Holdings Group
share option plan
HSBC Finance share
option plan
Number
(000s)
WAEP1
£
Number
(000s)
WAEP1
£
Number
(000s)
WAEP1
US$
2010
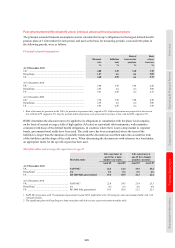
Outstanding at 1 January ...................................................... 172,526 3.69 157,719 7.12 2,736 9.29
Granted during the year2 ....................................................... 22,017 5.39 – – – –
Exercised during the year3 .................................................... (16,830) 4.18 (1,015) 6.08 (307) 9.29
Expired during the year ........................................................ (19,858) 4.44 (3,946) 7.36 – –
Outstanding at 31 December ................................................ 157,855 3.87 152,758 7.12 2,429 9.29
At 31 December 2010
Exercise price range (£):
3.00 – 4.50 ......................................................................... 126,198 – –
4.51 – 6.00 ......................................................................... 26,036 – –
6.01 – 7.50 ......................................................................... 3,864 119,439 –
7.51 – 9.29 ......................................................................... 1,757 33,319 2,429
Of which exercisable ............................................................ 1,883 152,758 2,429
Weighted average remaining contractual life (years) .......... 2.76 2.33 1.89
1 Weighted Average Exercise Price.
2 The weighted average fair value of options granted during the year was US$2.11 (2010: US$2.41).
3 The weighted average share price at the date the options were exercised was US$8.65 (2010: US$10.08) and US$9.51 (2010: US$10.26)
for the Savings-related share option plans and HSBC Holdings Group share option plan respectively.
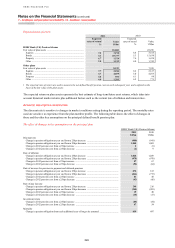
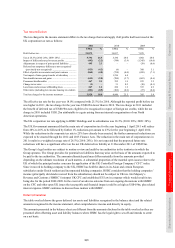
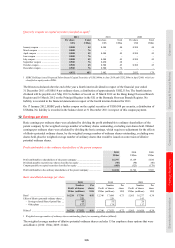
10 Tax
Tax charged to the income statement
2011 2010 2009
US$m US$m US$m
Current tax
UK corporation tax ..................................................................................................... 820 383 206
– for this year ........................................................................................................... 462 404 280
– adjustments in respect of prior years .................................................................... 358 (21) (74)
Overseas tax1 .............................................................................................................. 4,255 3,328 1,847
– for this year ........................................................................................................... 4,155 3,235 1,826
– adjustments in respect of prior years .................................................................... 100 93 21
5,075 3,711 2,053
Deferred tax ................................................................................................................ (1,147) 1,135 (1,668)
Origination and reversal of temporary differences ................................................. (1,178) 1,176 (1,672)
Effect of changes in tax rates .................................................................................. (3) 31 (10)
Adjustments in respect of prior years ...................................................................... 34 (72) 14
Total tax charged to the income statement.................................................................. 3,928 4,846 385
1 Overseas tax included Hong Kong profits tax of US$997m (2010: US$962m; 2009 US$783m). The Hong Kong tax rate applying to the
profits of subsidiaries assessable in Hong Kong was 16.5% (2010: 16.5%; 2009: 16.5%). Other overseas subsidiaries and overseas
branches provided for taxation at the appropriate rates in the countries in which they operate.