HSBC 2011 Annual Report Download - page 33
Download and view the complete annual report
Please find page 33 of the 2011 HSBC annual report below. You can navigate through the pages in the report by either clicking on the pages listed below, or by using the keyword search tool below to find specific information within the annual report.-
 1
1 -
2
-
3
-
4
-
5
-
6
-
7
-
8
-
9
-
10
-
11
-
12
-
13
-
14
-
15
-
16
-
17
-
18
-
19
-
20
-
21
-
22
-
 23
23 -
 24
24 -
 25
25 -
 26
26 -
 27
27 -
 28
28 -
 29
29 -
 30
30 -
 31
31 -
 32
32 -
 33
33 -
 34
34 -
 35
35 -
 36
36 -
 37
37 -
 38
38 -
 39
39 -
 40
40 -
 41
41 -
 42
42 -
 43
43 -
44
-
45
-
46
-
47
-
48
-
49
-
50
-
51
-
52
-
53
-
54
-
55
-
56
-
57
-
58
-
59
-
60
-
61
-
62
-
63
-
64
-
65
-
66
-
67
-
68
-
69
-
70
-
71
-
72
-
73
-
74
-
75
-
76
-
77
-
78
-
79
-
80
-
81
-
82
-
83
-
84
-
85
-
86
-
87
-
88
-
89
-
90
-
91
-
92
-
93
-
94
-
95
-
96
-
97
-
98
-
99
-
100
-
101
-
102
-
103
-
104
-
105
-
106
-
107
-
108
-
109
-
110
-
111
-
112
-
113
-
114
-
115
-
116
-
117
-
118
-
119
-
120
-
121
-
122
-
123
-
124
-
125
-
126
-
127
-
128
-
129
-
130
-
131
-
132
-
133
-
134
-
135
-
136
-
137
-
138
-
139
-
140
-
141
-
142
-
143
-
144
-
145
-
146
-
147
-
148
-
149
-
150
-
151
-
152
-
153
-
154
-
155
-
156
-
157
-
158
-
159
-
160
-
161
-
162
-
163
-
164
-
165
-
166
-
167
-
168
-
169
-
170
-
171
-
172
-
173
-
174
-
175
-
176
-
177
-
178
-
179
-
180
-
181
-
182
-
183
-
184
-
185
-
186
-
187
-
188
-
189
-
190
-
191
-
192
-
193
-
194
-
195
-
196
-
197
-
198
-
199
-
200
-
201
-
202
-
203
-
204
-
205
-
206
-
207
-
208
-
209
-
210
-
211
-
212
-
213
-
214
-
215
-
216
-
217
-
218
-
219
-
220
-
221
-
222
-
223
-
224
-
225
-
226
-
227
-
228
-
229
-
230
-
231
-
232
-
233
-
234
-
235
-
236
-
237
-
238
-
239
-
240
-
241
-
242
-
243
-
244
-
245
-
246
-
247
-
248
-
249
-
250
-
251
-
252
-
253
-
254
-
255
-
256
-
257
-
258
-
259
-
260
-
261
-
262
-
263
-
264
-
265
-
266
-
267
-
268
-
269
-
270
-
271
-
272
-
273
-
274
-
275
-
276
-
277
-
278
-
279
-
280
-
281
-
282
-
283
-
284
-
285
-
286
-
287
-
288
-
289
-
290
-
291
-
292
-
293
-
294
-
295
-
296
-
297
-
298
-
299
-
300
-
301
-
302
-
303
-
304
-
305
-
306
-
307
-
308
-
309
-
310
-
311
-
312
-
313
-
314
-
315
-
316
-
317
-
318
-
319
-
320
-
321
-
322
-
323
-
324
-
325
-
326
-
327
-
328
-
329
-
330
-
331
-
332
-
333
-
334
-
335
-
336
-
337
-
338
-
339
-
340
-
341
-
342
-
343
-
344
-
345
-
346
-
347
-
348
-
349
-
350
-
351
-
352
-
353
-
354
-
355
-
356
-
357
-
358
-
359
-
360
-
361
-
362
-
363
-
364
-
365
-
366
-
367
-
368
-
369
-
370
-
371
-
372
-
373
-
374
-
375
-
376
-
377
-
378
-
379
-
380
-
381
-
382
-
383
-
384
-
385
-
386
-
387
-
388
-
389
-
390
-
391
-
392
-
393
-
394
-
395
-
396
-
397
-
398
-
399
-
400
-
401
-
402
-
403
-
404
-
405
-
406
-
407
-
408
-
409
-
410
-
411
-
412
-
413
-
414
-
415
-
416
-
417
-
418
-
419
-
420
-
421
-
422
-
423
-
424
-
425
-
426
-
427
-
428
-
429
-
430
-
431
-
432
-
433
-
434
-
435
-
436
-
437
-
438
-
439
-
440
 |
 |

31
Overview Operating & Financial Review Corporate Governance Financial Statements Shareholder Information
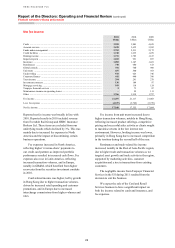
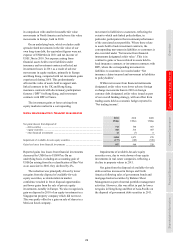
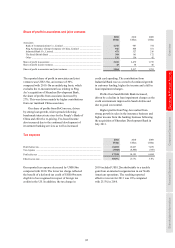
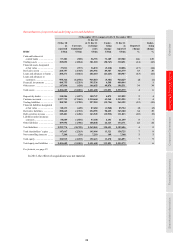
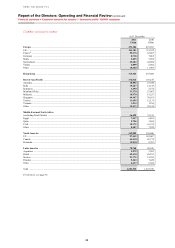
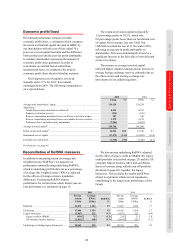
Share of profit in associates and joint ventures
2011
US$m
2010
US$m
2009
US$m
Associates
Bank of Communications Co., Limited ................................................................. 1,370 987 754
Ping An Insurance (Group) Company of China, Limited ..................................... 946 848 551
Industrial Bank Co., Limited .................................................................................. 471 327 216
The Saudi British Bank .......................................................................................... 308 161 172
Other ....................................................................................................................... 126 156 42
Share of profit in associates ........................................................................................ 3,221 2,479 1,735
Share of profit in joint ventures .................................................................................. 43 38 46
Share of profit in associates and joint ventures .......................................................... 3,264 2,517 1,781
The reported share of profit in associates and joint
ventures was US$3.3bn, an increase of 30%
compared with 2010. On an underlying basis, which
excludes the re-measurement loss relating to Ping
An’s acquisition of Shenzhen Development Bank,
the share of profits from associates increased by
27%. This was driven mainly by higher contributions
from our mainland China associates.
Our share of profits from BoCom rose, driven
by strong loan growth, wider spreads following
benchmark interest rate rises by the People’s Bank of
China and effective re-pricing. Fee-based income
also increased due to the continued development of
investment banking services as well as increased
credit card spending. The contribution from
Industrial Bank rose as a result of continued growth
in customer lending, higher fee income and a fall in
loan impairment charges.
Profits from Saudi British Bank increased,
driven by a decline in loan impairment charges as the
credit environment improved in Saudi Arabia and
due to good cost control.
Higher profits from Ping An resulted from
strong growth in sales in the insurance business and
higher income from the banking business following
the acquisition of Shenzhen Development Bank in
July 2011.
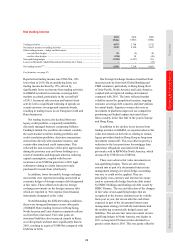
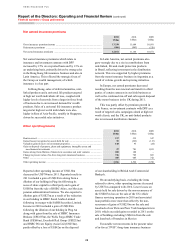
Tax expense
2011
US$m
2010
US$m
2009
US$m
Profit before tax .......................................................................................................... 21,872 19,037 7,079
Tax expense ................................................................................................................ (3,928) (4,846) (385)
Profit after tax ............................................................................................................. 17,944 14,191 6,694
Effective tax rate ......................................................................................................... 18.0%
25.5%
5.4%
Our reported tax expense decreased by US$0.9bn
compared with 2010. The lower tax charge reflected
the benefit of a deferred tax credit of US$0.9bn now
eligible to be recognised in respect of foreign tax
credits in the US. In addition, the tax charge in
2010 included US$1.2bn attributable to a taxable
gain from an internal reorganisation in our North
American operations. The resulting reported
effective tax rate for 2011 was 18% compared
with 25.5% in 2010.